Event History Timeline
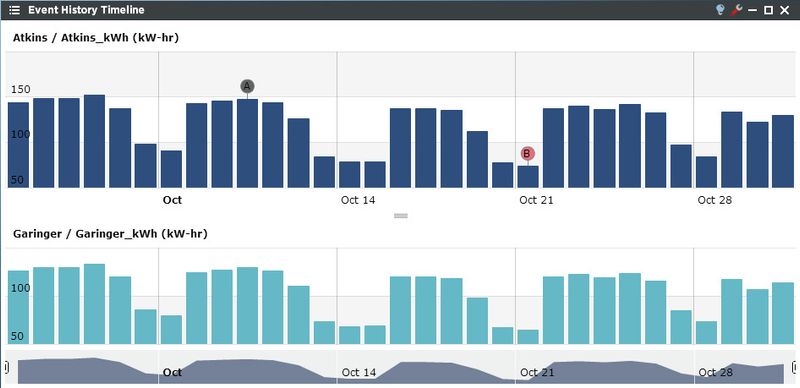
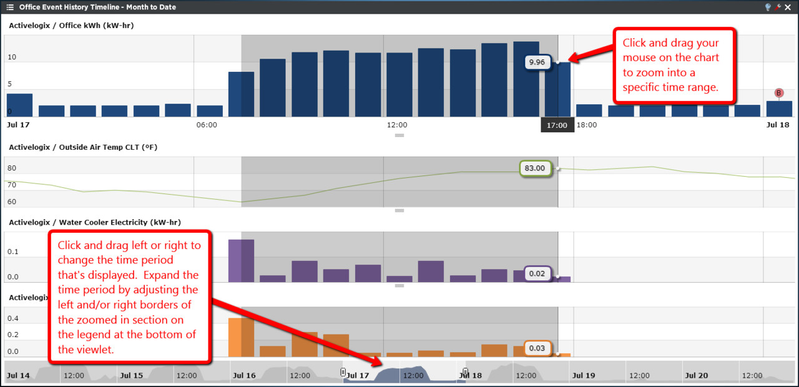
The Event History Timeline provides a powerful stacked chart view for consuming large amounts of information. This Viewlet also has capability to drill down into smaller time periods and display user configurable events. The Event History Timeline is ideal to use when you're interested in analyzing more than two trends with different units of measurement over a common time period (for example temp, cost, therms, kwh, and kw all in the same chart). Hovering over the chart displays all of the values for the charted variables as well as the time stamp. The user also has the ability to click and drag their mouse over the Viewlet to zoom into a specific time period. The time period selected can be adjusted by using the period selection tool at the bottom of the viewlet. The time period can be zoomed into further, expanded out, or you can click on the zoomed in portion at the bottom of the Viewlet and scroll left or right for a time sequence view of the data.
Event History Timeline Configuration
Trends:
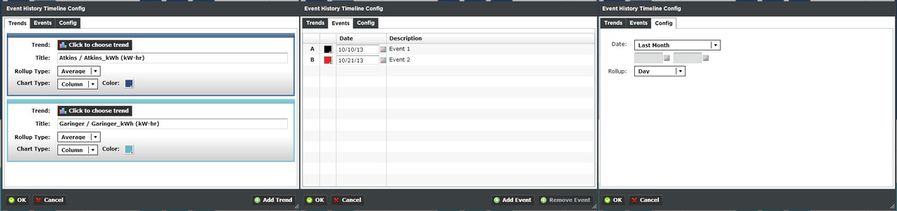
On the Trend tab, the user can select the trend they wish to display. Filter through multiple trends by selecting Locations or Units, or both. Additionally you can start typing in the trend name in the search box to narrow down the search field. Add additional trends via the "Add Trend" button. Note it's recommended that you don't add more than 5 for performance reasons. Rollup Type, Chart Type, and Chart color can also be selected
Events:
Use the Events tab to add or remove events by entering the event name and the date of the event. Example: “Lighting Retrofit Completed on 2/23/2011”.
Config:
Lastly, use the Config tab to select the date range of interest using one of the pre-defined periods (Year-to-date, Month-to-date, Last Year, etc.) or a custom date range. A variable roll-up period can also be selected if desired.