Point Line Chart Viewlet
The Point Line Chart Viewlet graphs real-time values, as it plots constantly updated lines representing selected units of measurement. Changes in the lines can help the user detect malfunctioning equipment or environmental fluctuations. Right clicking on the chart allows the user to manually change the range of the Y-Axis with the ‘Y-Axis Picker’ should the need arise.
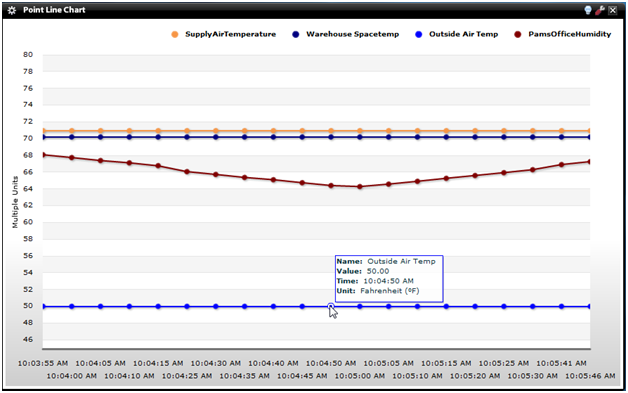
The Point Line Chart constantly updates with new values from right to left, updating itself in user-defined time increments.
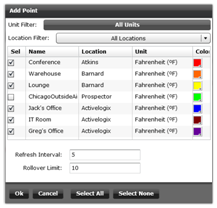
Point Line Chart Configuration
Points can be filtered by unit or location from drop-down lists within the Point Line Chart configuration menu. Points can then be selected and deselected by checking the boxes on the left of the menu. Corresponding colors can be set so the user can tell which line represents a specific value. The refresh interval (in seconds) allows the user to configure how often the points update. The rollover limit determines how many points or nodes are plotted before the viewlet pushes the last plotted node off of the chart and plots a new one. Additionally, the max and min values of the Y-Axis are configurable by clicking on them.