Virtual Trends & History Groups
Virtual Trends and History Groups are available as an optional feature within Periscope and provide a very powerful suite of capabilities enabling effortless creation of related trends based on a native trend. For example, virtual trends can be created that are in equivalent units of an existing trend, such as a BTU trend built from a kWh trend. Virtual trends can also be mathematical derivatives of the native trend using any formula desired by the user. Once created, the virtual trends can be used like any other AX trend and are continually updated as additional native data is added to the original trend.
A Note About Virtual Trends
Since these trends are created based on source trends, it's possible that due to some data manipulation or clean-up on the integrator's side a source trend may no longer exist. If this is the case it could disrupt some of the functionality of our virtual trends. As a result, instead of allowing for the removal of virtual trends, all virtual trends are deleted when their trends are removed. Please notice that when selecting a conversion or rollup the typical remove trend button changes it's text to indicate that it is going to delete instead. Deleting the virtual trend deletes the underlying history function the backend as well as the associated history in the database.
Likewise, since virtual trends are created based on some heavy calculation and merging of source trends, it's possible that they may not be instantaneously available. If checking validity please keep this in mind and allow some time for the trend to calculate before assuming it has failed. Some virtual trends may take a long time to first be calculated since it starts as far back as the oldest history goes. Future calculations based on the execution interval are faster since they don't have to account for the beginning of time.
Setting up Virtual Trends
Setting up Virtual Trends is easy. First click on the Trend tab on the top menu of periscopeconfig.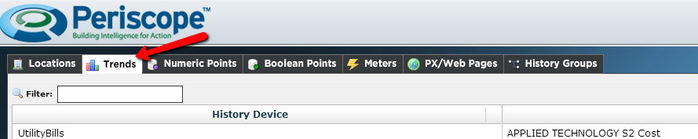
Next select a trend you'd like to convert from the bottom panel of mapped trends and click the convert button: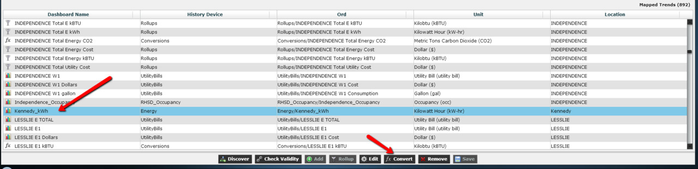
Virtual trends allow users to change units or create new trends dynamically in periscopeconfig. For example, a user can have trending kWh and want to convert it to BTU without involving Niagara AX. Now “BTU” can be chosen and Periscope will create a new “virtual trend” which will then be usable in Periscope as if it were a normal AX trend.
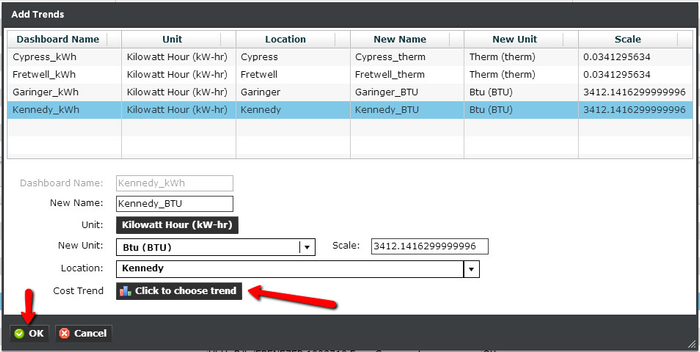
Within periscopeconfig, The Convert Trends menu allows the user to create their own formulas for calculating trends.
Note: You can select a cost trend for whichever unit is selected for the electricity and natural gas properties under the global configuration window (below). In this case, kWh. Some viewlets like Resource Consumption have a cost icon that will typically use cost/kwh to calculate the values. This cost trend feature will let the user pick their own cost trend if they already have one set up in AX.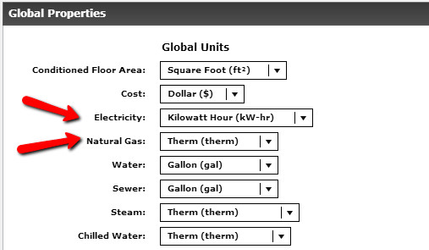
Lastly, once you select ok in the Add Trends window and refresh your dashboard, you can locate your new converted trend inside of Periscope, when you go to configure your viewlet: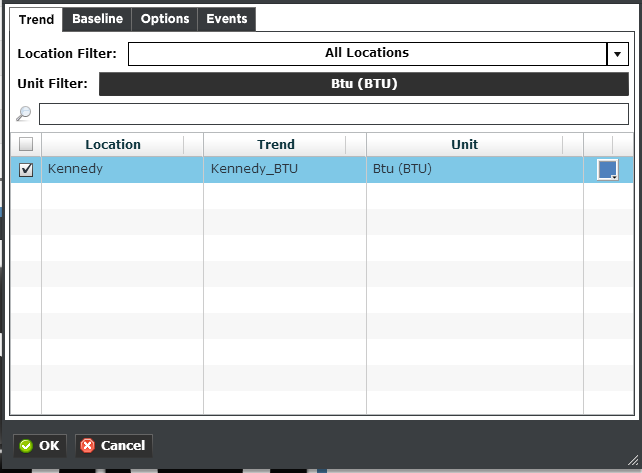
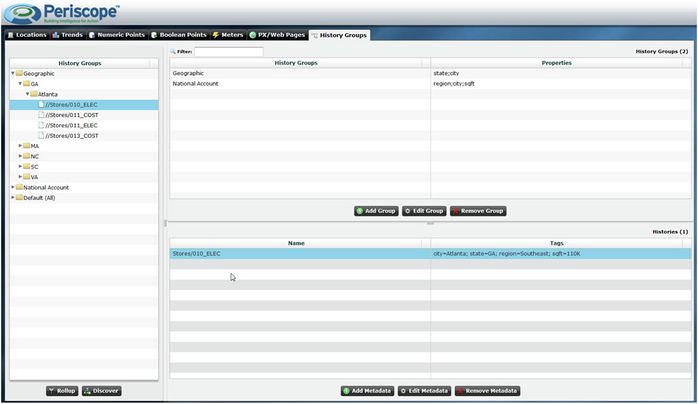
History Groups
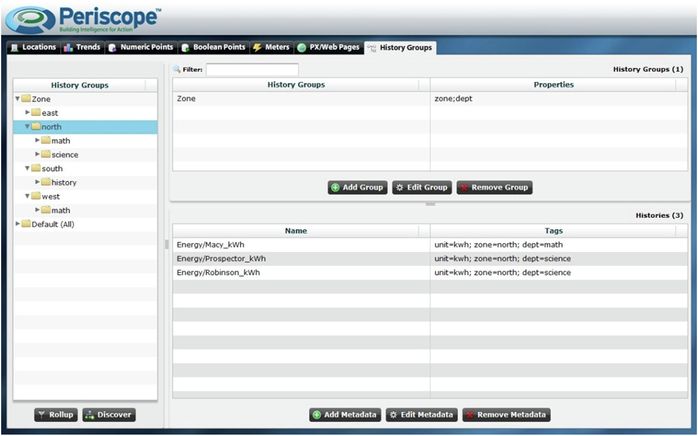
Located in periscopeconfig, this tab enables users to group and roll-up their trends by unit type, zones, owners, building types, etc. The solution uses History Groups and metadata (tags in AX) to create multiple hierarchies of these trends. The Periscope design closely resembles the AX Metadata Browser. The value that Periscope adds will be the ability to roll up to any level in the hierarchy (saving substantial configuration time over basic AX methods).
Utilities in this feature include the following:
- Enhanced ability to define, manipulate and visualize the History Group functions.
- Ability to easily add, edit and delete History groups.
- Drag and Drop support enabling the ability to dynamically move trends into other levels of the hierarchy using Drag and Drop ease.
And the ability to rollup historical data in only 2 steps:
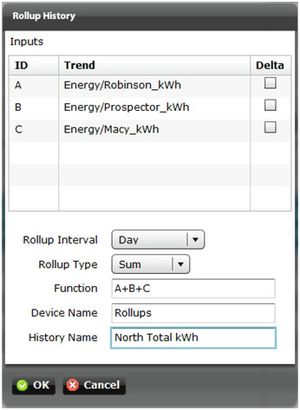
Rolling up historical data is as easy as selecting the histories that you wish to roll-up and hitting the ‘Rollup’ button.
This brings up the ‘Rollup History’ prompt where you can customize your rollup to:
- On a per-trend basis, use the change in value of a trend instead of the value of the trend itself by selecting the "delta" checkbox. (For instance, if it's an accumulating trend and you want the delta, select the "Delta" checkbox - this allows you to roll-up both accumulating and delta trends based upon the original history setup in AX.)
- Rollup daily, hourly, or every 15 minutes.
- Apply a custom function to the rollup. Users are able to provide custom scalar values to convert to a unit that Periscope may not have in its library. For example, a scalar could be a custom mathematical equation like (x *15 + 32) which would multiply the trend by 15 and add 32.
- Set the device name to save under in AX.
- Set the history name that will be created.
Editing Virtual Histories / Dynamic History Editor

When editing or creating a new virtual history (also referred to sometimes as a 'History Function') the Dynamic History Editor is used. From the Dynamic History Editor it's possible to drag trends into the virtual history to assign them input ids. Virtual histories are comprised of these lettered inputs and then passed through a series of options to derive a new history that is recalculated from the input histories on the execution interval. Options and details outlined below.
History Inputs:
- ID - a trend's ID is for use with the Function section of the virtual history. Please see details below.
- Delta - each trend has an optional delta checkbox. Delta should be selected for a trend if it's desired that we rollup the delta of that particular trend instead of the actual trend value. This is useful for accumulating trends. Note that if the input history is flagged as accumulating in periscope, it still needs to have the delta selected in the history function. (automatic pre-filling based on accumulation detection potentially coming at a later date)
Virtual History:
- Execution Interval - frequency in which the virtual history will update. Note that using virtual histories can be potentially resource heavy depending on the number of inputs, function complexity, etc. It's recommended that this be the longest period of time acceptable.
- Rollup Interval - virtual history functions at their base, are rollups. Here we set the interval in which we'd like to rollup the inputs.
- Rollup Type - type of rollup to perform. Rollups are applied to each individual history before it's finalized in the virtual history. For example, if hourly average was selected for the interval/type, input A's hourly average would be used for the A value in the history function (not A+B+C+D+E's hourly average - rather, it would be a sum of averages).
- Ignore Zeroes - removes a history input from the function in the event that it's value was zero for a given timestamp. Note that this only happens for that particular timestamp and does not remove the input entirely.
- Include Null Values - by default, if a null value is encountered for any history input at a timestamp then the entire timestamp entry is dropped for the resulting virtual history. By checking include null values, these timestamps will not be dropped. Including null values may be a good idea if you'd like to make a virtual history that includes an input that may be entirely null or have some null spots (in the case of entirely missing or partially missing data). Our reasoning for dropping null values by default is that we did not want to give the wrong impression if a user used inputs 'CostA', 'CostB', and 'CostC' trends, summed them up, and then expected it to be a sum of all of their cost in the event that one of these trends was potentially null.
- Function - mathematical function using the history inputs as variables. Supports all basic mathematical operators.
- History Name - resulting virtual history name that we would like for this virtual history to have on our backend.
- Unit - unit of the resulting virtual history trend.
- Location - standard trend location selector.
- Accumulates - flag for if the resulting virtual history is expected to be an accumulating trend. Would be accumulating if all inputs were accumulating and delta was not checked for any inputs.
Organize Data with Metadata
Adding & Editing History Groups
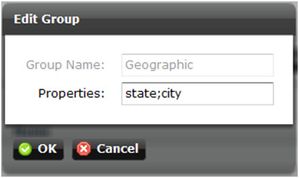
Each history group is simply a named folder with a list of properties separated by semi-colons. This semi- colon separated list for a history group represents the properties that denote child folders of the history group. In the picture above you can see that the “Geographic” history group is organized by state, then city. Order is important when creating the properties of a history group as it denotes your history group tree structure on the left-hand side.
Adding & Editing Metadata
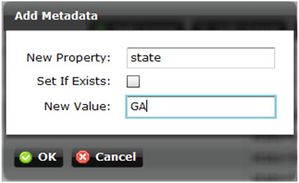
To add a new Atlanta, GA trend to our history groups we would click ‘Add Metadata’ on the trend we wished to add to the history group and add the state and add the two properties ‘state’ and ‘city’. Note that this can be done to multiple histories at a time by selecting more than one trend from either the histories window or history group navigation tree.
Dragging & Dropping to Add Metadata
Drag and dropping trends into history folders does the same thing as adding the necessary tags to the trend. A single trend, groups of trends, or entire device folders can be dragged and dropped at a single time into the history groups navigation tree to make for easy maintenance.
Additional Info Regarding History Groups (Zones, Rollups, etc) Limitations
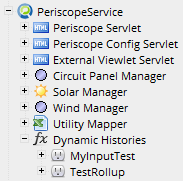
All types of "created" histories in Periscope are in some way, shape, or form, related back to objects called history functions in AX and are stored under the Dynamic Histories container (seen below). Currently there is not a hard cap of any kind on the number of history functions a single instance of Periscope can hold other than the hard-disk space limitations with respect to the new, resulting histories from the rollup. Periscope's lack of a limit on the number of history functions is due to numerous factors, the first of which being that a hard limit would be primarily determined from the hardware specifications of the Web Supervisor. Hardware specifications for the web supervisor vary too widely from instance to instance to serve as a baseline for this first possible method of estimation.
Second, there is not a true "limit" that would reflect the optimal performance of the Web Supervisor and dashboard. For instance, to some users, 50% overall cpu load at all time would reflect a well-running system where-as another instance might be considered fine when running at 70-80% cpu consistently. We can generate our own guidelines, but this again is too vague to apply for the common user. Put simply, the breaking point for history functions is whatever puts their running time (performed on an interval for calculating new records) longer than their execution interval - but problems could occur way before this point with PX pages and/or the dashboard in terms of slowness or inaccuracies.
Currently, Periscope has been tested with as many as 250 history functions (note that a zone - Energy Insight only - contains 3 each). Running more than 250 history functions may result in potential performance issues depending on your Web Supervisor's hardware and configuration.
"MyInputTest" and "TestRollup" are examples of History Functions. History functions are created by creating zones, rollups, or conversions.