Energy Profile Viewlet
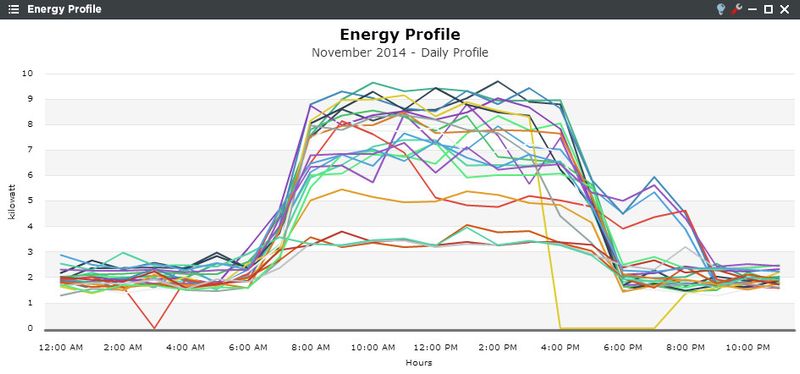
The Energy Profile Viewlet enables users to quickly identify anomalies in data and compare average profiles to different periods of times or different trends.
Energy Profile Configuration
Trends:
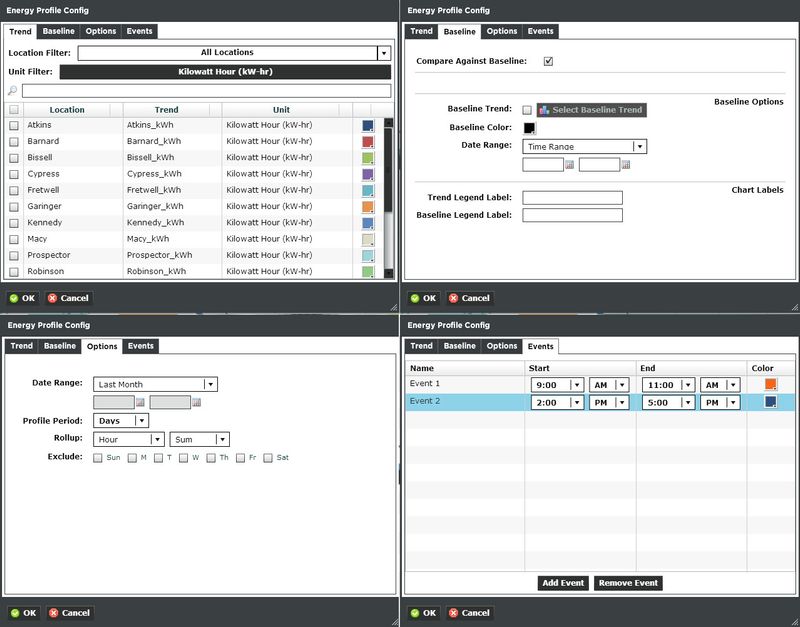
You can select a single trend by filtering Locations or Units, or both. Additionally you can start typing in the trend name in the search box to narrow down the search field. The Units are dictated by the global properties inside Periscope Config If you don't like the default color, you can change it via the color boxes on the far right.
Baseline:
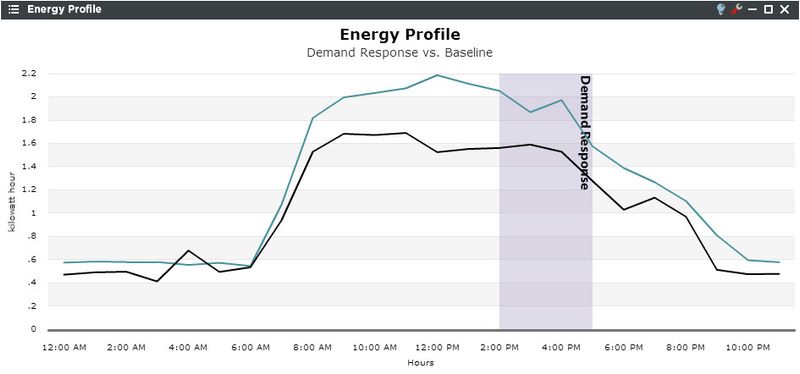
The baseline will compare the current trend data with a user selected previous period. Select Baseline period, or select time range and pick a start and end date in the calendar. To reduce confusion use the Trend Legend Label and Baseline Legend Label to make it clear what the user is seeing.
Options:
- Date Range: Select the time span shown for the selected trend. Selecting 'Time Range' will allow for using the calendar boxes below.
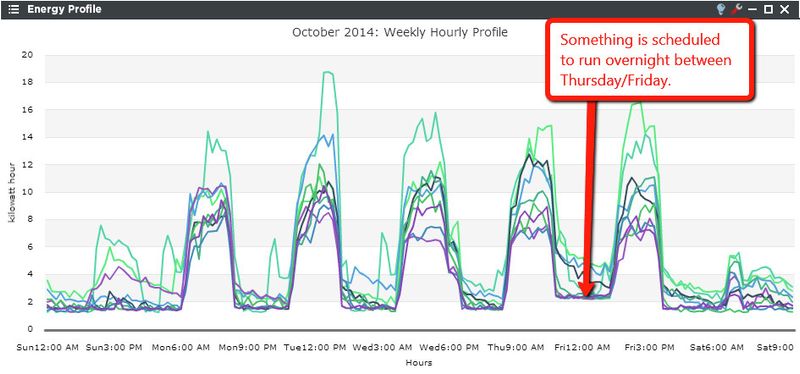
- Profile Period: Select Days or Weeks to show a range of one day or one week on the graph. *If set to Weeks, the Exclude Days option and Events tab will be inaccessible.
- Rollup: Select the period of time that you want data to be presented on the graph. If the Period is set to Days, set the rollup to Hour. If the Period is set to weeks, set the rollup to day.
- Exclude: Determine which days you want to show on the graph. *Profile Period must be set to Days for this option.
Events:
If you have the Profile Period on the Options tab set to Days, You can select common times or unique events to display behind the graph to show why the values did or didn't change for a selected time period.