Baseline Comparison Viewlet
The Baseline Viewlet enables comparison of the value of any trended variable, such as energy consumption, production, resource usage, etc. for the “current” time period versus a prior time range, creating a “baseline” period. The comparison may be visualized either in direct units, or through a “delta mode” showing the net of current minus baseline values. This is very useful in highlighting changes in performance over time.
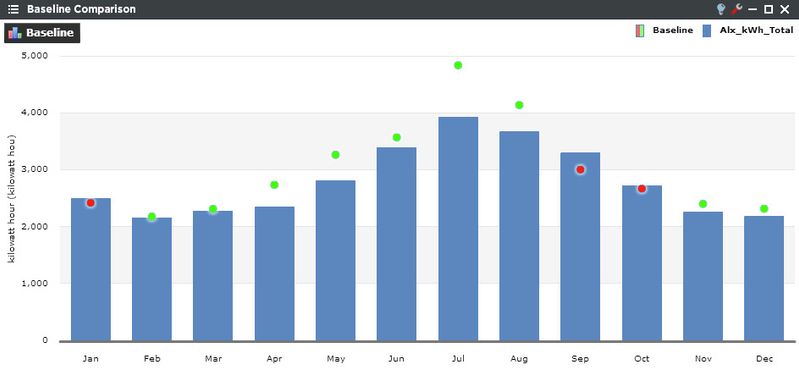
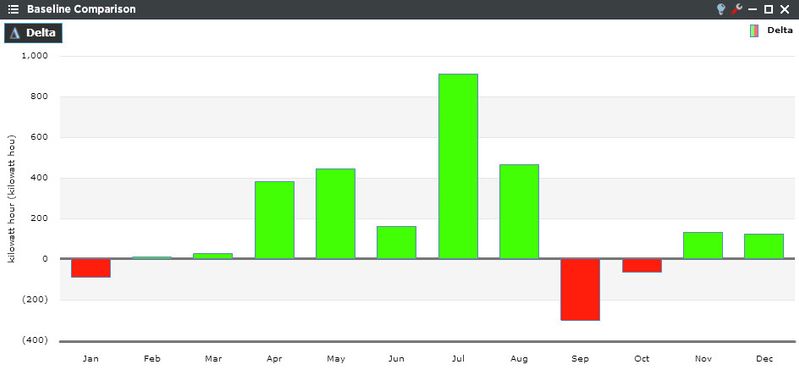
The baseline can be plotted as a line, dashed line, or color-coded bubbles, as seen in the example above. The user can visualize their changes in performance through the delta mode, where the differences are effectively presented. If the performance orb option is selected, the user can display a colorized orb that displays increase or decrease percentages.
Baseline Comparison Configuration
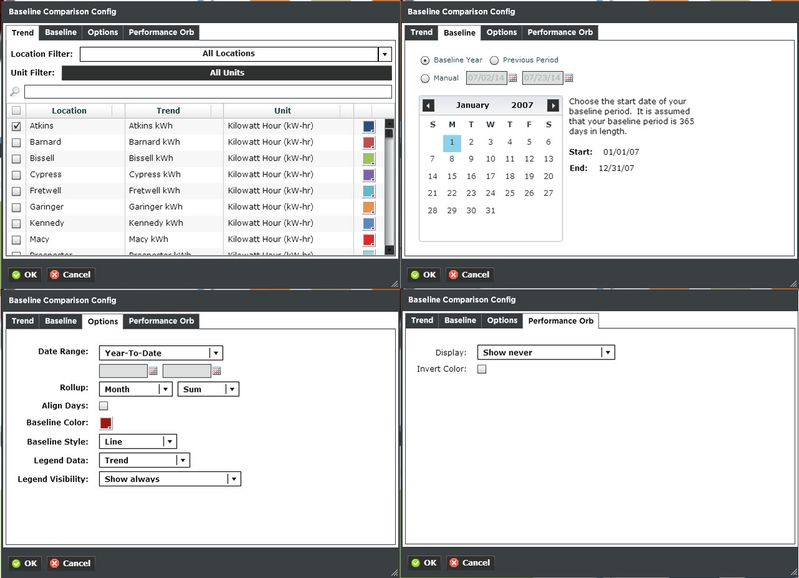
Trends:
You can select a single trend by filtering Locations or Units, or both. Additionally you can start typing in the trend name in the search box to narrow down the search field. The Units are dictated by the global properties inside Periscope Config If you don't like the default color, you can change it via the color boxes on the far right.
Baseline:
The baseline will compare the current trend data with a user selected previous period. Select Baseline Year and pick a start date in the calendar. Selecting Previous Period will set the baseline to the previous date range dictated in the Options tab. Selecting Manual will let you pick a specific start and end date.
Options:
- Date Range: Select the time span shown for the selected trend. Selecting 'Time Range' will allow for using the calendar boxes below.
- Rollup: Select Avg, Min, Max, Sum values of the trend based on selected date ranges.
- Align Days: The align days feature will automatically align the days of the week for the baseline period. For example, when comparing this month vs. last month, the first day of the month may not be the same weekday for the baseline period. Since many buildings behave differently on weekends this can skew results. The align days will cause the baseline range to shift forwards or backwards to the closest same day of the week to accommodate.
- Baseline Color: Sets the color of the baseline.
- Baseline Style: Line, Dashed Line, or Bubble.
- Legend Data: Show the Location, Trend, or both labels on the top left of the viewlet.
- Legend Visibility: Show always, never, or only when the viewlet is maximized.
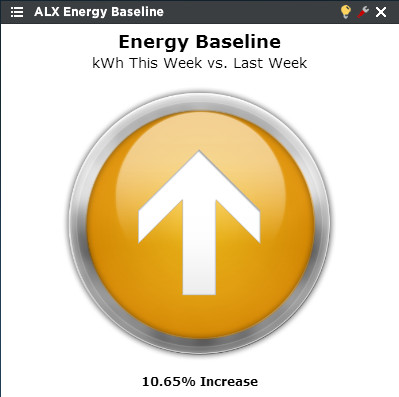
Performance Orb:
Adds a color graphic arrow orb to the viewlet, enabling “at-a-glance” determination of better or worse conditions for a selected data set. The user can select if up or down is good or bad, and when or if the orb is displayed.