Network Health Viewlet
The Network Health Viewlet is an automatically configured chart that presents the user with a graphical representation of their network’s hierarchy. It is useful for immediate recognition of components and device health within the Niagara network.
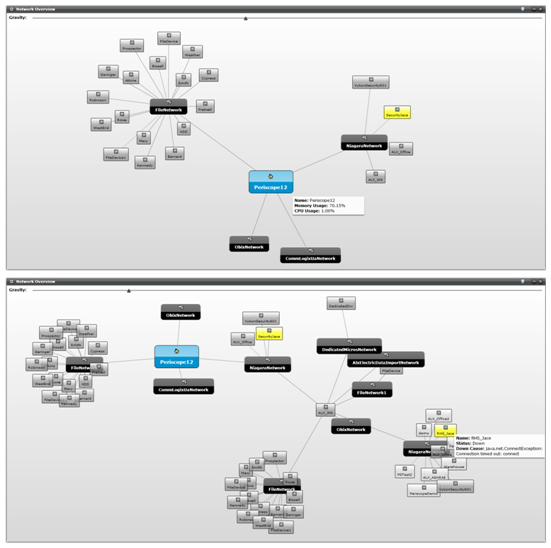
These screenshots are of the same workstation within a Niagara network. Double-clicking on an expandable branch of the network such as the ALX_WS box in the top graphic triggers an exploded view. The yellow colored node designates a problem or health issue with one branch on the network. When moused over, a pop-up box presents the user with information on the location and cause of the problem.
Network Health Configuration
The Network Health Viewlet automatically builds a network representation for the user. The viewlet’s only option lies in the “gravity” slider located at the top of the viewlet. More gravity (scroll right) lengthens the distance between the branches on the network’s display. Less gravity (scroll to left) brings the branches closer together. Nodes can also be moved around the window by clicking and dragging the desired box.