Weather Normalization Viewlet
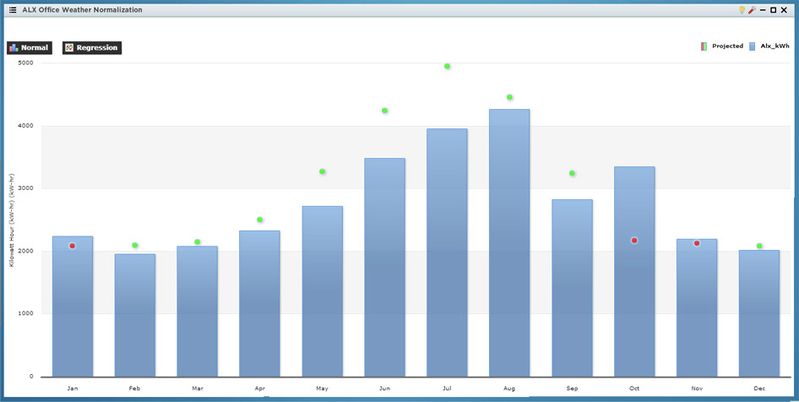
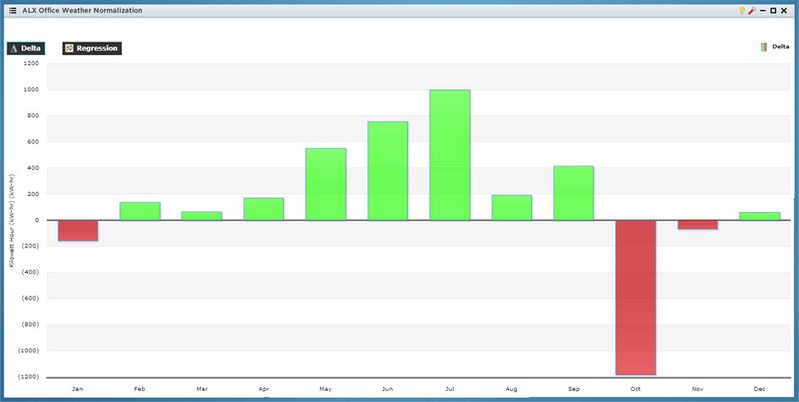
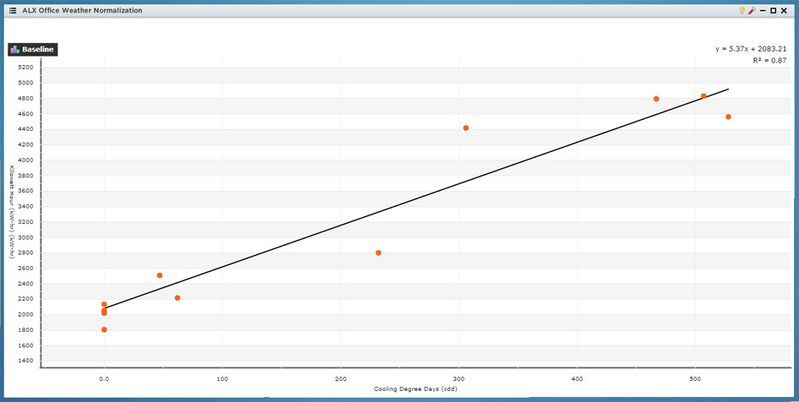
The Weather Normalization viewlet uses linear regression analysis of degree day and consumption data to find a best fit line. Once found, actual consumption data is baselined against the predicted data based on weather trends which allows the visualization of performance independent of weather. There are three different views: normal baseline, delta baseline, and a regression view.
Weather Normalization Configuration
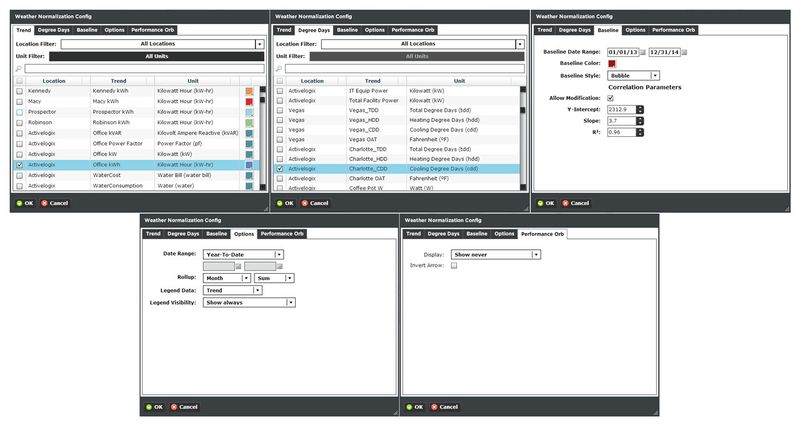
Setting up the Weather Normalization viewlet is a multi-step process.
Trend:
You can select a single trend by filtering Locations or Units, or both. Additionally you can start typing in the trend name in the search box to narrow down the search field. The Units are dictated by the global properties inside Periscope Config. If you don't like the default color, you can change it via the color boxes on the far right.
Degree Days:
Just like the trend setup. Tip: do a quick search for 'degree' to narrow down the field of applicable trends.
Baseline:
- Baseline Date Range: Select the time span to compare the current trend period against.
- Baseline Color: Simply the color the baseline will be.
- Baseline Style: Select Line, Dashed Line, or Bubble as a style.
- Correlation Parameters: Changes the metrics of the baseline by adjusting the Y-Intercept, Slope, and R² values.
Options:
- Date Range: Select the time span shown for the selected trends. Selecting 'Time Range' will allow for using the calendar boxes below.
- Rollup: Select Avg, Min, Max, Sum values of trends based on selected date ranges.
- Legend Data: Show the Location, Trend, or both labels on the top right of the viewlet.
- Legend Visibility: Show always, never, or only when the viewlet is maximized.
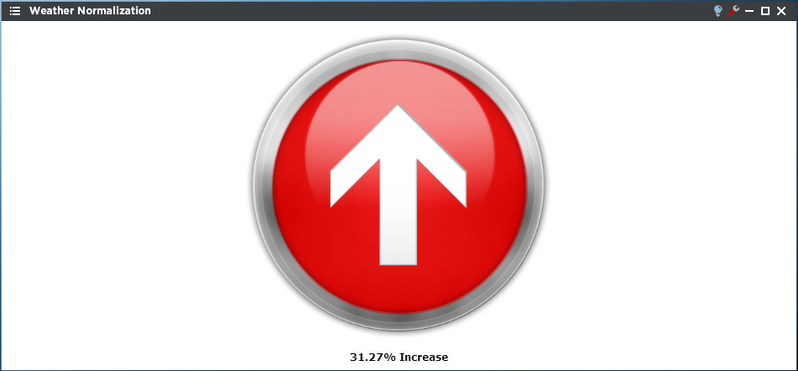
Performance Orb:
The Performance Orb quickly shows the user the status of the trend in question by showing a colored circle that changes hue as the performance changes. Additionally the user can configure the viewlet to show calculations of loss or gain with the or down arrow shown, and percentage saved or overage. The User can choose to show the performance orb always, never, or only when maximized.