History ColorGrid Viewlet
The History ColorGrid Viewlet is used to analyze complex arrays of data using color visualization of variations in the values of the data being analyzed. This feature is useful in rapidly detecting instances of cyclical data variations over user-selectable time periods.
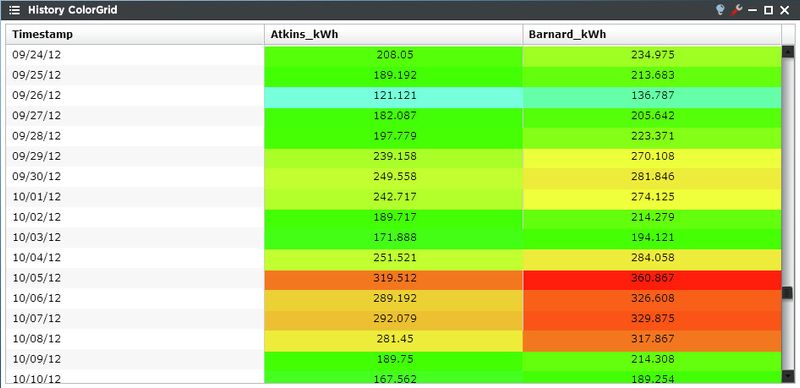
Seemingly obvious trends in numeric data can be visualized efficiently and easily through the use of color assignment to ranges of data.
History ColorGrid Configuration
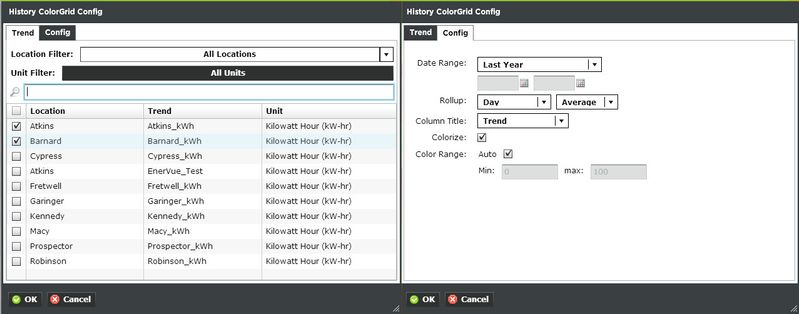
The user’s configuration options for the History ColorGrid consist of a standard “trend” tab for selecting the multiple variables which will be plotted in the table. The user can select as many trends as they would like to compare, and are only limited by the on-screen space available for displaying them in the viewlet. The “options” tab has the usual time range selection menu and rollups, along with several options relating to the colorization of the chart. The user can toggle the colors on or off at any time, and enter a custom numeric range to control which values designate the most extreme colors. Dark blue represents the lowest color, where as dark red represents the highest.
Trends:
You can select multiple trends by filtering Locations or Units, or both. Additionally you can start typing in the trend name in the search box to narrow down the search field. The Units are dictated by the global properties inside Periscope Config.
Config:
- Date Range: Select the time span shown for the selected trends. Selecting 'Time Range' will allow for using the calendar boxes below.
- Rollup: Select Avg, Min, Max, Sum values of trends based on selected date ranges.
- Column Title: Display the Trend name, Location, or both above each column.
- Colorize: Checking this will paint a broad spectrum of color over each value to let you determine differences quickly.
- Color Range: Either leave it set to auto (default) or select a numeric range that represents the values displayed on the viewlet. The values closest to min will be blue and those closest to max will be red.