Circular Gauge Viewlet
The Circular Gauge Viewlet is an analog display which can monitor real-time values of a unit such as temperature, power, pressure, etc. The large “speedometer” style display can provide the user with an instant status indication of important variables, and has customizable colored zones for unique configurations.
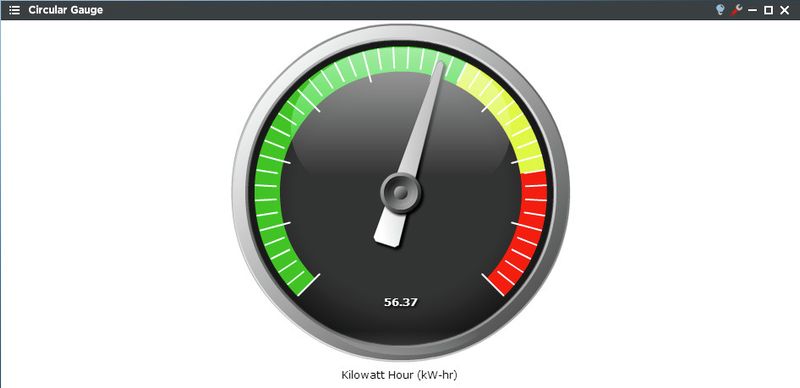
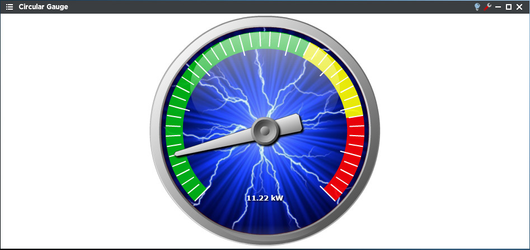
This Circular Gauge Viewlet shows a real-time kWh value, which appears to be approaching the yellow indicator zone. A numeric readout is given in the bottom center of the gauge below the needle, and can display values to the hundredth.
Circular Gauge Configuration
The Circular Gauge can be set up to show three configurable color-coded status zones. The minimum and maximum values of the gauge can be set, and the span of each zone within those values can be adjusted using the slider. The user can also change the label of the gauge for identification purposes, or the background image for a custom theme.
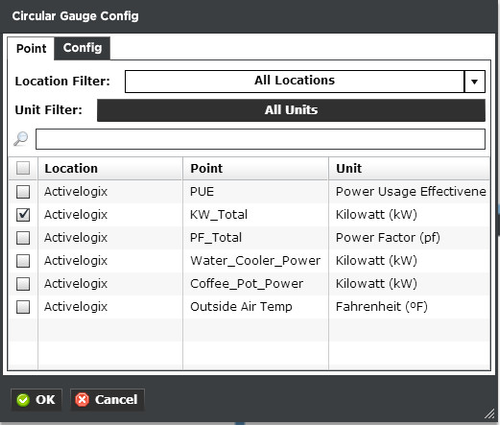
Points:
You can select a point by filtering Locations or Units, or both. Additionally you can start typing in the point name in the search box to narrow down the search field. The Units are dictated by the global properties inside Periscope Config.
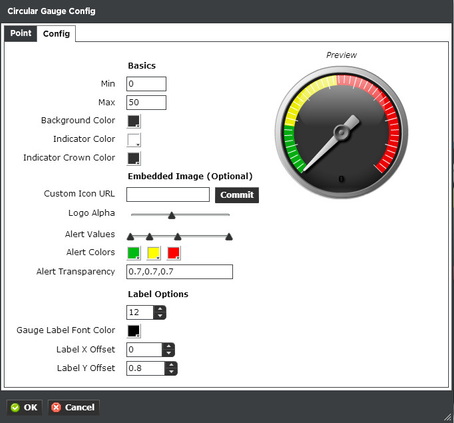
Config:
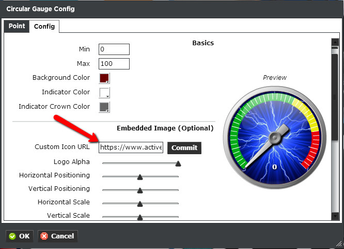
- New for 2.4: Custom URL & Image Positioning: This lets the user upload their own background image for the gauge from a web address. Additionally the user can fine tune the size and shape of the image and how it displays on the gauge face. See Custom Image Loader for more information.
- Basics: Set the max and min range for the gauge, as well as needle and background colors.
- Logo Alpha: Sets the transparency of the custom image.
- Alert Values: Sets the color ranges for the gauge.
- Alert Colors: Changes the range colors.
- Alert Transparency: Changes the transparency of the range colors.
- Font Size: Adjusts the size of the font for the gauge value.
- Gauge Label Font Color: Color of the font.
- Label Offset X&Y: Changes the location of the gauge value on the face of the gauge.