Resource Consumption Viewlet
The Resource Consumption Viewlet can be used to display the monthly or daily consumption of a utility resource (e.g. Electric, Water, Gas, etc.). Double-clicking on a month’s display will drill down to a daily or hourly breakdown of energy usage during that time. Single or multiple locations can be graphed in a viewlet in a stacked or clustered display. The viewlet displays circles above current time-frame’s columns giving period-ending consumption predictions. Users can also click on the monthly data to view daily usage for that month.Conversion icons can be selected at the bottom of the viewlet when at full screen, and on each side is an arrow allowing the user to scroll through yearly data, if available.
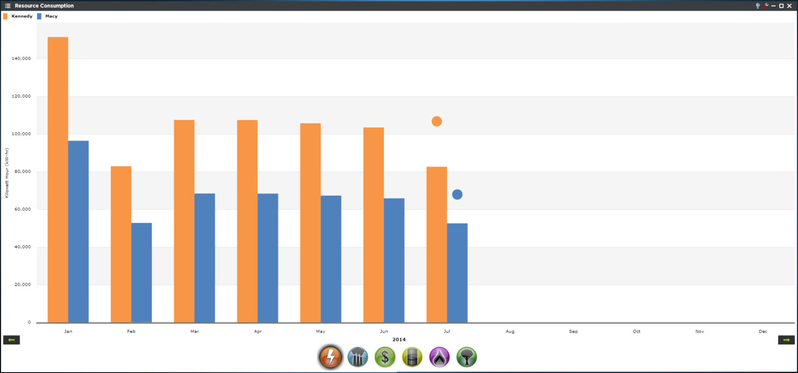
The Resource Consumption Viewlet is unique in its ability to convert energy usage into alternative units of measurement.
Configuration
Trends:
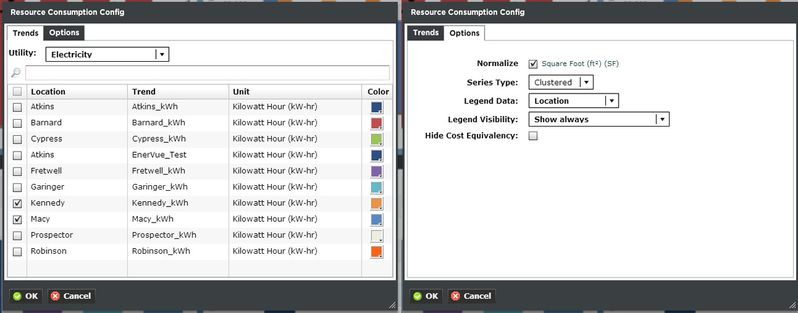
You can select multiple utility trends such as electricity, gas, sewer, and water. Additionally you can search for the trend you're looking for. The Units are dictated by the global properties inside Periscope Config. If you don't like the default color, you can change it via the color boxes on the far right.
Options:
- Normalize: Compares trend values based on relative floor sizes. This can be adjusted to sq ft, or sq meter in the global properties setting of Periscope Config.
- Series Type: Show the graph stacked or clustered.
- Legend Data: Show the Location, Trend, or both labels on the top left of the viewlet.
- Legend Visibility: Show always, never, or only when the viewlet is maximized.