KPI
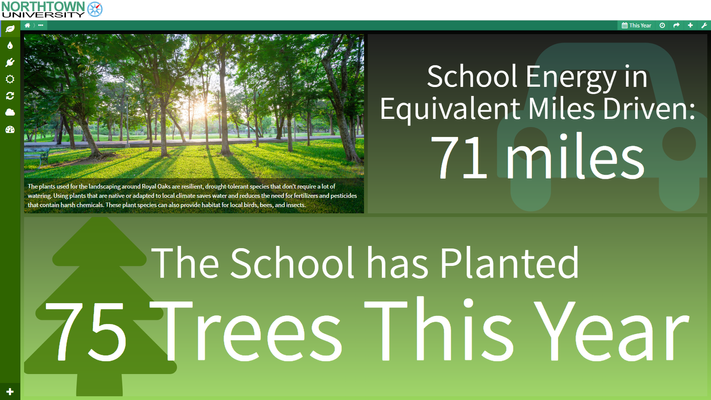
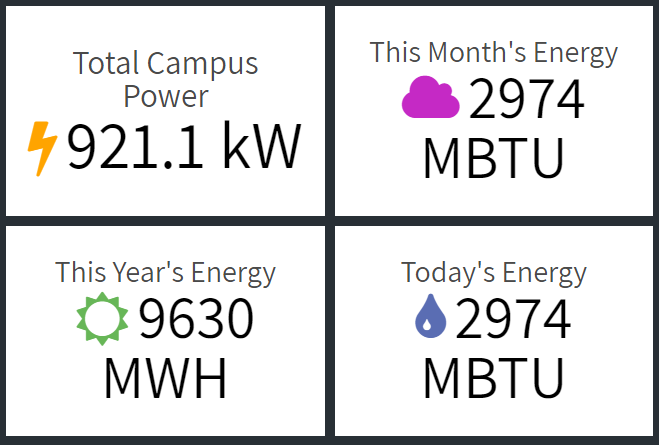
The KPI viewlet can be configured to show the current value of any monitored variable or total value for a period of time. For example, "Yearly Savings to Date", "Avoided CO2", "Campus kWh this Month", etc. It can be configured to mirror real-time point data or calculate an accumulated value over a period of time such as “This Month”. Using the KPI Viewlet's "conversions" option in its configuration menu, users can also convert standard units into other relative measurements, including sustainability-focused options like barrels of oil, equivalent miles driven, metric tons of CO2, household energy per year, and acres of trees.
Configuration
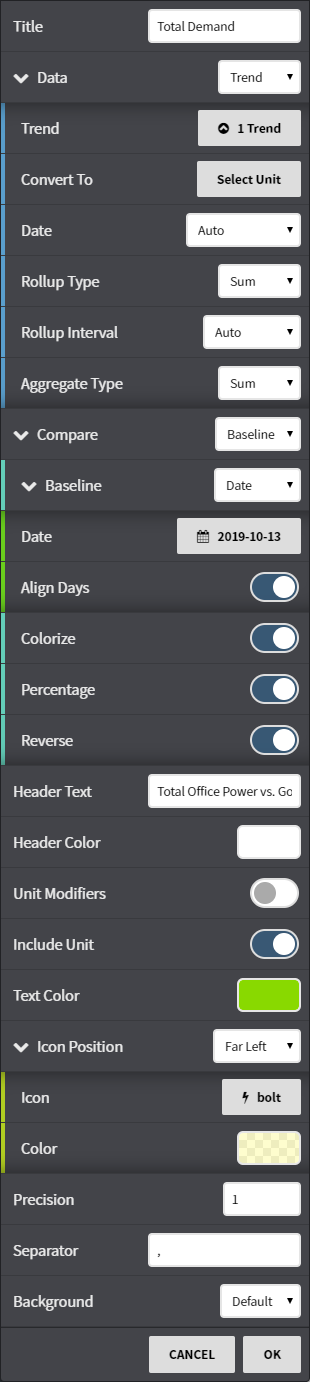
Configuration Options:
- Title: Set a custom viewlet title.
- Data: Choose to select a specific point or trend. Select from available trends using either the Picker or Query mode.
- Convert to: Convert the data to comparable units such as kWh to MWh or kWh to BTU's.
- Date: Fine tune when the trend's data is shown. Can be set to auto (global control), a preset date range, or a user selected date range.
- Rollup: Select auto, or manual for more rollup control over rollup time, and rollup types such as Avg, Min, Max, Sum values of the trend based on selected date ranges.
- Compare: Compare the point or trend showing to another point, trend, or static number. There are options to colorize, reverse, or set as percentage the comparison.
- Header Text: Add a sub-title inside the viewlet and modify its color.
- Unit Modifiers: Add a word, letter, number or symbol before or after the value displayed.
- Include Unit: Display the default facet for the value.
- Text Color: Adjust the color of the primary value.
- Icon Position: Add and modify an icon in the viewlet.
- Precision: How many digits past a decimal you'd like there to be displayed.
- Background: Set the color and opacity of the background field.