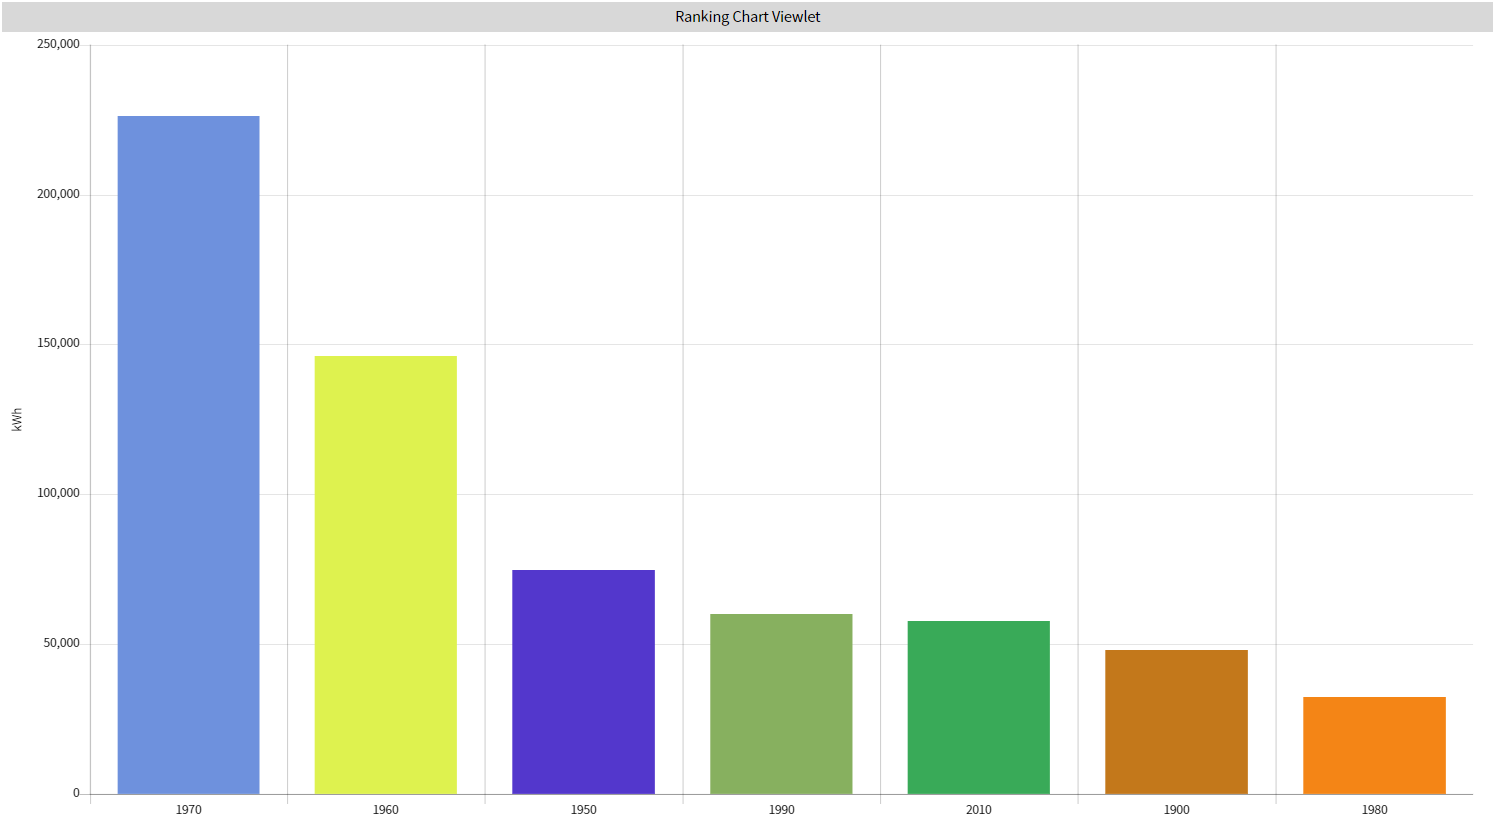
Ranking Chart
The Ranking Chart enables the user to display comparative values for similar variables, ranked in either increasing or decreasing order. If appropriate, values may be normalized based on certain criteria, such as conditioned area (SF).
Configuration
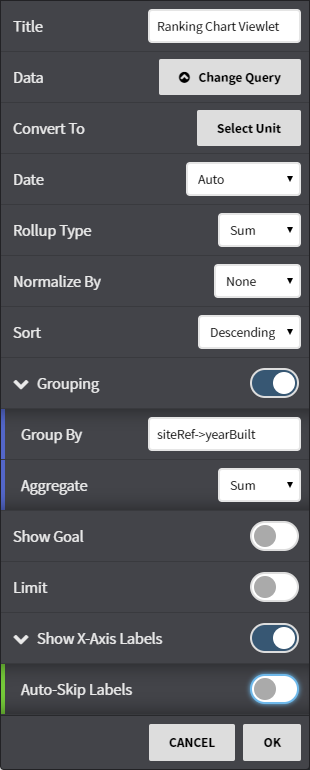
Configuration Options:
- Title: Set a custom viewlet title.
- Data: Select from available trends using either the Picker or Query mode.
- Convert To: Convert the data to comparable units such as kWh to MWh or kWh to BTUs.
- Date: Fine tune when the trend's data is shown. Can be set to auto (global control), a preset date range, or a user selected date range.
- Rollup Type: Select Avg, Min, Max, Sum values of trends based on selected date ranges.
- Normalize By: Normalization averages data such as energy consumption based upon common units of measurement such as square footage. Select between None or Site Area.
- Sort: Display the chart in either ascending or descending order.
- Grouping: Toggle the grouping feature on or off.
- Show Goal: Toggle a goal line on or off.
- Limit: Limits the number of trends shown - for example, "5" would result in a maximum of 5 trends.
- Show X-Axis Labels: Toggle X-axis labels on or off. Every other label can be skipped as well if a large amount of trends are displayed.
This feature requires the part number PER-SUSTAIN