Alarm Timeline View (Niagara)
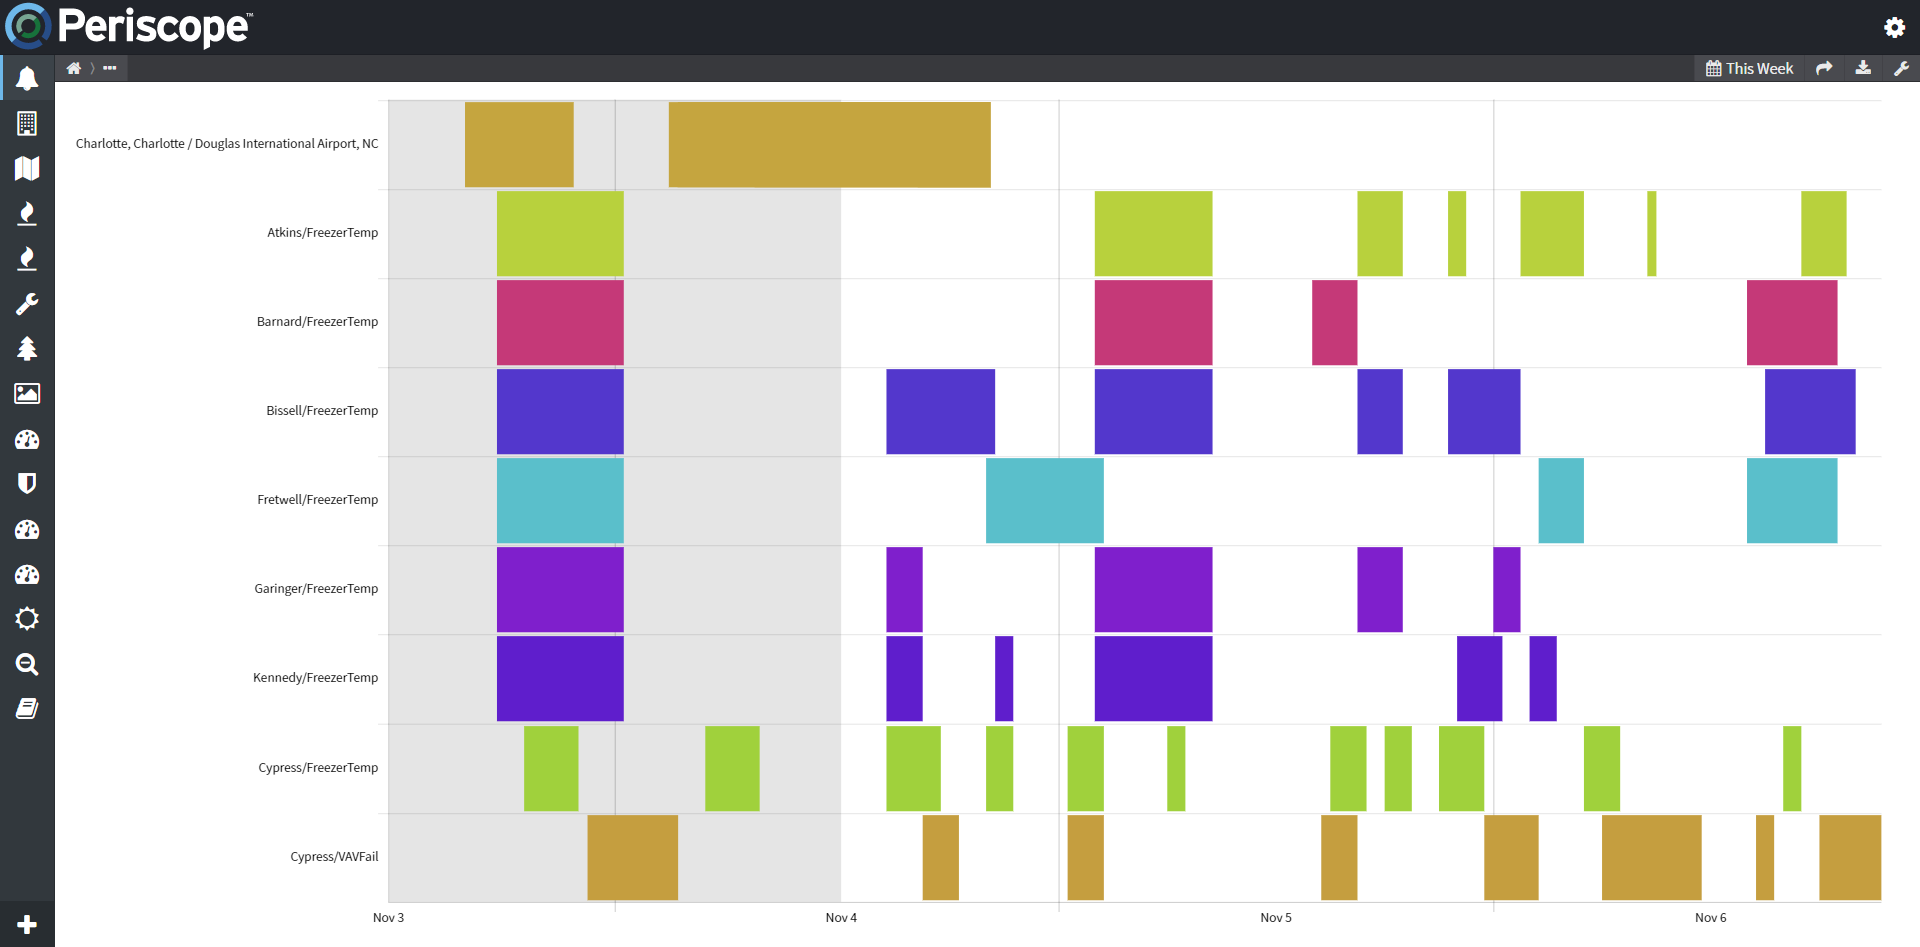
The Alarm Timeline View allows visualization of Niagara Alarms and Niagara Analytics. The timeline chart improves upon a typical tabular view and enables better visualization of alarm frequency and correlation between alarms. This chart supports filtering of the data to view alarms from specific sites or specific priorities.
Clicking on an alarm will bring up an alarm details page as seen below.
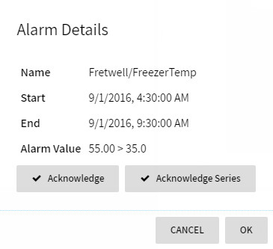
Clicking Acknowledge will set the state on the Niagara alarm to "Acknowledged" and Acknowledge Series will acknowledge all alarms of the currently selected series in batch. The visual timeline representations shown in the Alarm View will also disappear when the corresponding acknowledgements are made.
 Configuration
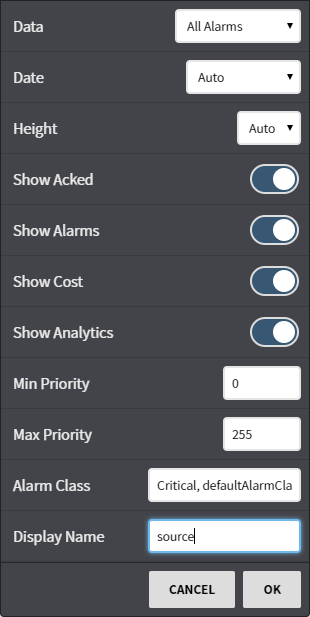
- Data: Show alarm data on all alarms, current context, or specific sites
- Date: Align with global date range selector or configure a custom range
- Height: Fill to available viewlet height or automatically take up as little space as possible based on the number of alarms
- Show Acked: After acknowledging an alarm, it will disappear from the view, by checking 'Show Acked' you can view all acknowledged alarms
- Show Alarms: Can optionally disable showing alarms in favor of showing only analytics
- Show Cost: Displays the cost associated with alarms/analytics provided it has been configured on the back-end
- Show Analytics: Enables the display of Niagara Analytic rules
- Min Priority: The minimum priority level that will be displayed on the chart (0-255)
- Max Priority: The maximum priority level that will be displayed on the chart (0-255)
- Alarm Class: Specifies the specific alarm class that this viewlet should render alarms/anaytics for, default is the "defaultAlarmClass" (this can also be a comma-separated list like: defaultAlarmClass,anotherAlarmClass,yetAnother)
- Display Name: This is the specific alarm data property that should be used as the display name in the viewlet. Defaults to the "source" of the alarm.
Niagara Alarm Setup
In order for alarms to show up in the Alarm Timeline chart they must contain refs within the Alarm Metadata which point to the correct Niagara Components. Refs are needed in order for the "Site" selection as well as the "Current Context" feature within the Data property. Periscope will uses these metadata properties to detmine which alarms should show up for a given context or site selection.
To set these up for a given Alarm Extension:
- Click on the ">>>" button in the Meta Data property
- Click "+" button to add a new metadata item
- Type siteRef in the "key" column and the handle of your site as the value (for example, "h:123")
Now when Periscope reads the Alarm Database it will understand that this alarm belongs to your Site "h:123". If you plan on using the Alarm Timeline down to the equipment level (or further) you would need to add the appropriate refs. For equipment this would be "equipRef".
Niagara Analytics Setup
Periscope has the ability to view Alerts generated by Niagara Analytics. To set this up, for each Alert:
- Navigate to the property sheet of your Alert
- Ensure that "Alarm" is set to true
This causes all alerts generated by Niagara Analytics to be routed to the Niagara Alarm Database. Periscope will attempt to look up your alerts "refs" to determine which site or equipment it belongs.
Since there is no "Source Name" of a Niagara Alert and because Alerts may be generated for multiple points, Periscope displays the Alert plus the display name of the point causing the error.
This feature requires the part number PER-ALARM