Heat Map View
The heat map provides a unique hourly spectrum of any trend. Using this view, one can quickly identify anomalies and visualize trends across data.
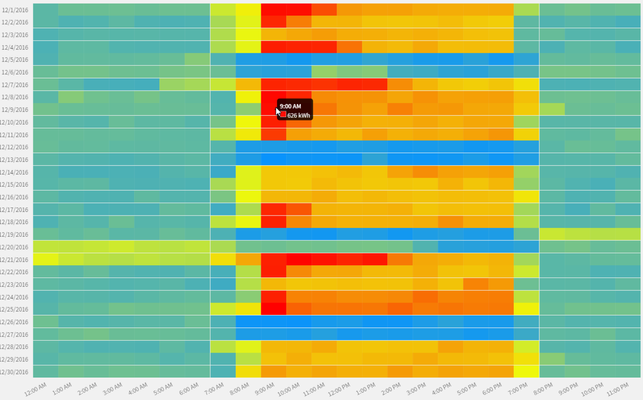
Rolling over the individual cells will show a time-stamp and value for that point in time.
Configuration
- Data - trend picker to choose the data displayed in the Heat Map
- Rollup Type - change how the data is rolled up
- Colors - the gradient of colors that are mapped to the low, medium, and high values of data
- Low - Lowest color
- Mid - Medium Color
- High - High Color
This feature requires the part number PER-ANALYTIC