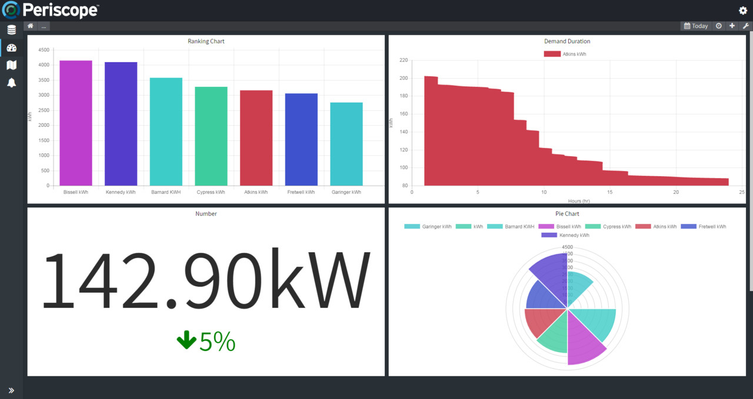
Dashboard View
The dashboard view is the most common screen seen in Periscope. The dashboard view is intuitive, responsive, and user-configurable. Dashboards can be setup to visualize any aspect of your building or an entire campus of buildings by utilizing a growing library of viewlets. Once in place, viewlets can be moved around and organized however you see fit. Just grab them and pull them around the screen. Viewlets can also be scaled so some are larger than others if for instance some charted data were more important than other data, simply grab the bottom right corner and drag to a desired size. Some viewlets can also be interacted with directly by either double clicking or alt-clicking their legend to show and hide specific trends or points. On mobile devices, the views will dynamically scale to fit the screen's proportions.
Adding Viewlets
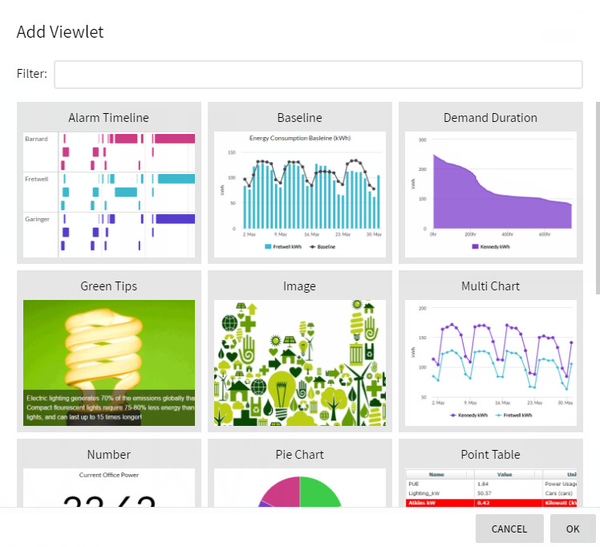
 Selecting the plus button will open up the "Add Viewlet" window. Here you'll find descriptions of each viewlet that can be added to the dashboard view.
Configuration
This will allow for further customization of how you desire the dashboard to look, including options such as margins, colors, and styles. This can be useful if you're setting up a view for a specific display such as a kiosk, and it needs to look perfect.
- Margin - amount of pixels margin around viewlets
- Columns - how many columns are available for the viewlets
- Background - color, gradient, or image of the dashboard background
- Viewlet
- Background - background color of viewlets
- Border Size - width of viewlet borders
- Border Color - color of viewlet borders
- Text Color - text color within viewlets
- Title Style
- Height - size in pixels of viewlet titles
- Background - background color of viewlet titles
- Text - Text color of viewlet titles
- Border Size - border size of viewlet titles
- Border Color - border color of viewlet titles