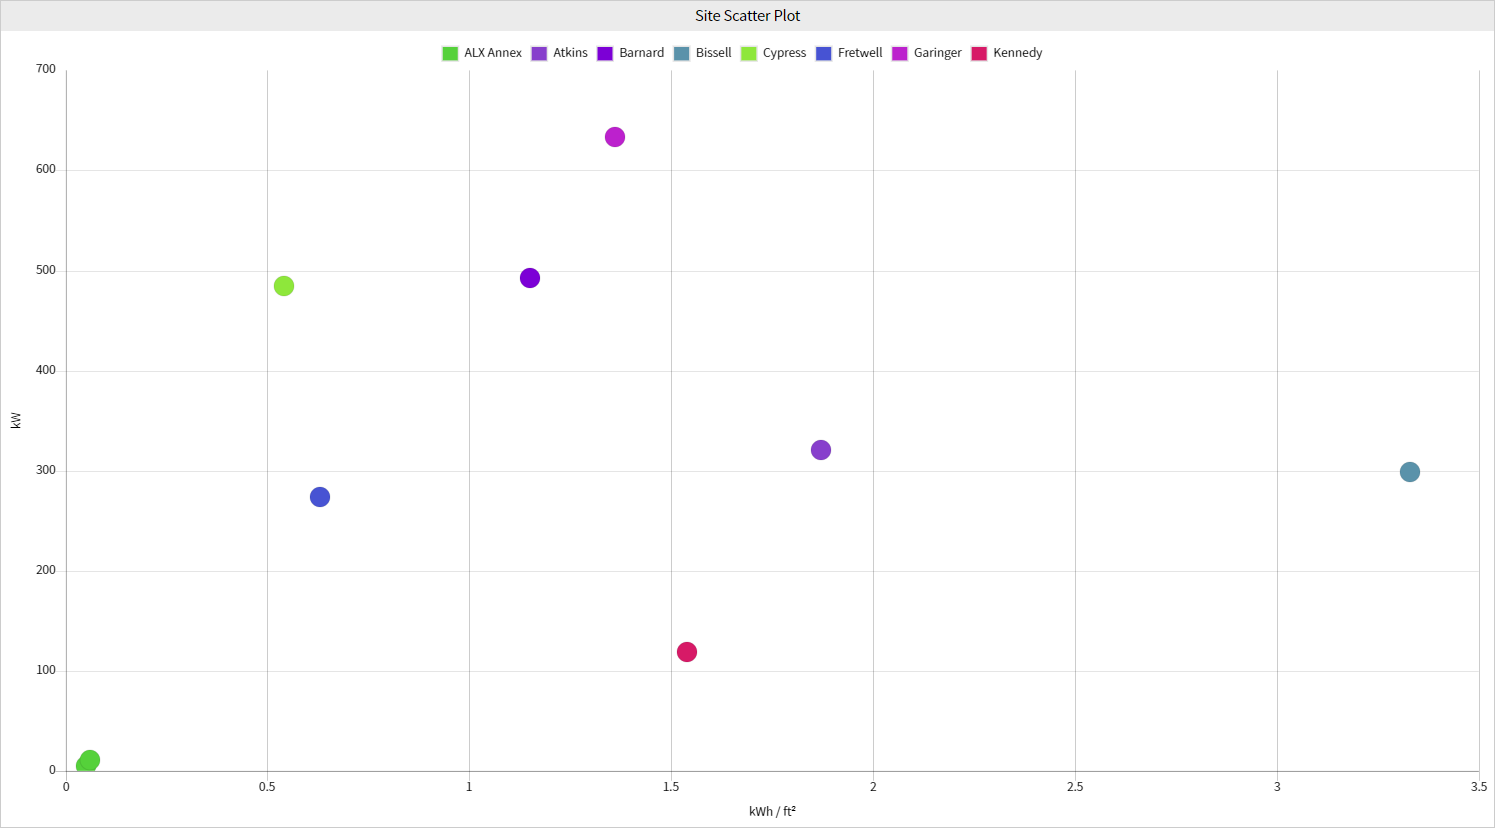
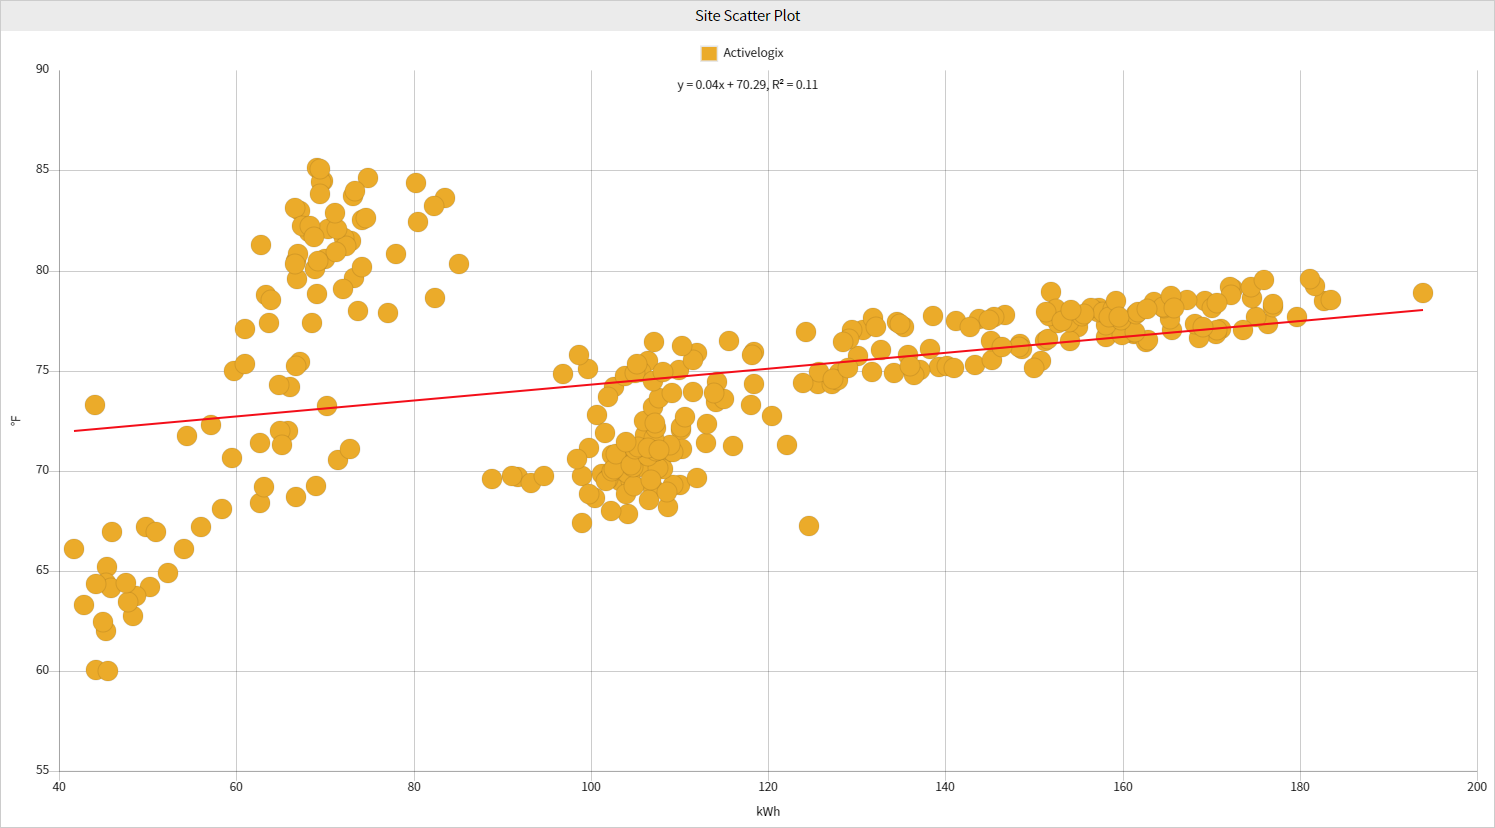
The Site Scatter Plot displays trend data points on an x and y-axis. This visualization enables easy display of relationships between two variables and how they change over time. Data regression line(s) can show the correlation values as a line of best fit between the two variables.
Configuration
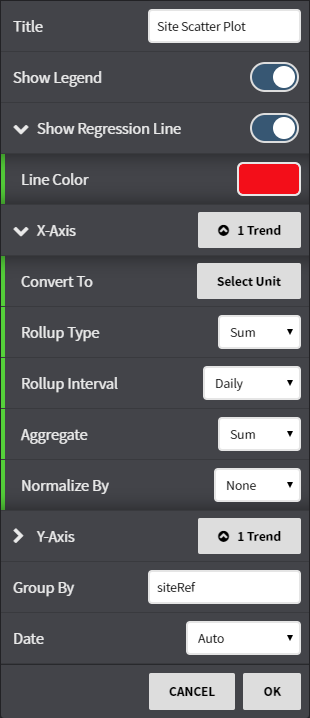
Configuration Options:
...