The Pie Chart viewlet can be used to show the relative value of multiple variables over time. For each interval over the selected time period, the viewlet can plot the Max, Min, Average, or Sum of the variable.  This particular viewlet can be displayed in a standard pie, a doughnut, or a polar area chart.
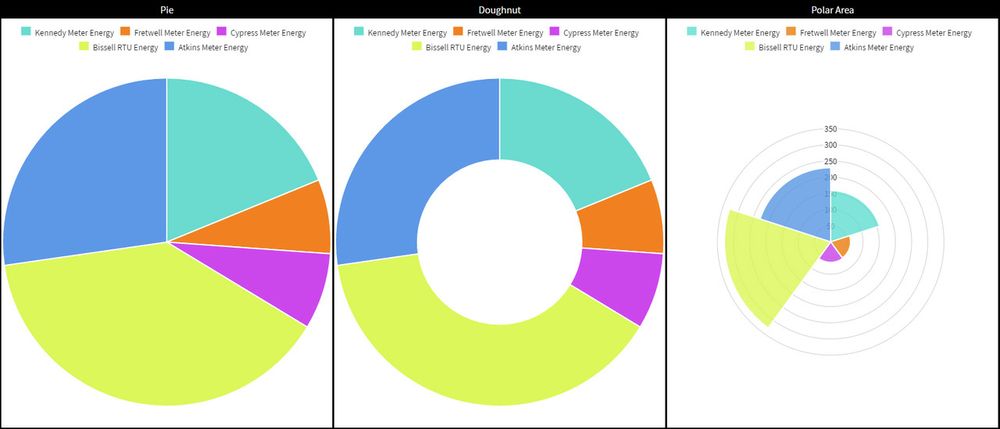
Configuration
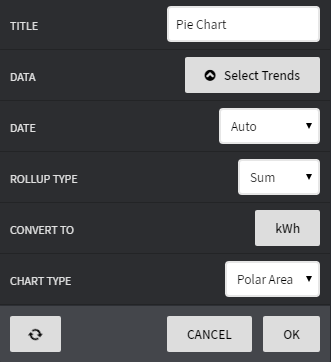
Configuration Options
...