The Map View serves as a navigation page to different buildings as well as an analytics tool by displaying real-time alarm information and spectrum trend data. Users can visualize building KPIs and setup new maps and locations in minutes.


Configuration
Outline- Edit Mode
- Coords
- View Link
- Show Labels
- Alarming
- Spectrum
- Spectrum Data
- Spectrum Style


Configuration Options:
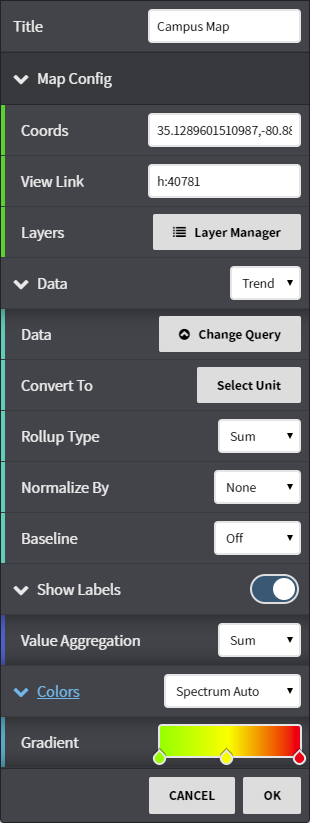
- Title: Configure a title.
- Map Config: Enter manual coordinates, set the view link (hyperlink) to where the map locations will take the user, and manage layers.
- Data: Select and configure the data to be displayed on the map.
- Show Labels: Toggle site labels on or off and configure the values shown.
- Colors: Configure the map to show a color spectrum based on the point or trend values or to show alarms.
Edit Mode

By selecting the wrench in the upper-right corner of the view or viewlet, the user can enable edit mode. Enable Edit Mode if you would like to:
- Associate buildings to sitessites to polygons on the map
- Adjust the default map center and zoom level
With Edit Mode enabled, you will notice buildings on the Map have a dotted outline, indicating they are available to have a site associated to them. To associate a building site to a sitelocation on the map, first click on an available buildingdotted polygon. A dialog will appear containing all the sites available to be associated. Select a site and press OKAYOK. Now, the site and building outline are tied.
Disable Edit Mode for normal Map operation.
Coords
The default center coordinates of the Map, as “latitude,longitude”. This field will automatically update when in Edit Mode changes are completed.
View Link
This field is used to create a hyper-link from buildings on the Map to a site-level view, allowing for further exploration of a particular site. The field expects a ViewID. This tag beginning with “h:” can be found in the browser’s URL when viewing the desired View. For example, if the view you would like to link to has the URL, “/#/view/h:1234”, the ViewID would be “h:1234”.
Spectrum Data
Data selection, Rollup Type, and Normalize are all described in other areas of this document, and behave the same way here. Baseline compares the current value of each site against that site’s previous value. View the documentation for the Baseline Viewlet for further information regarding baseline configuration.
Show Labels
Labels show the site’s name on their associated building.
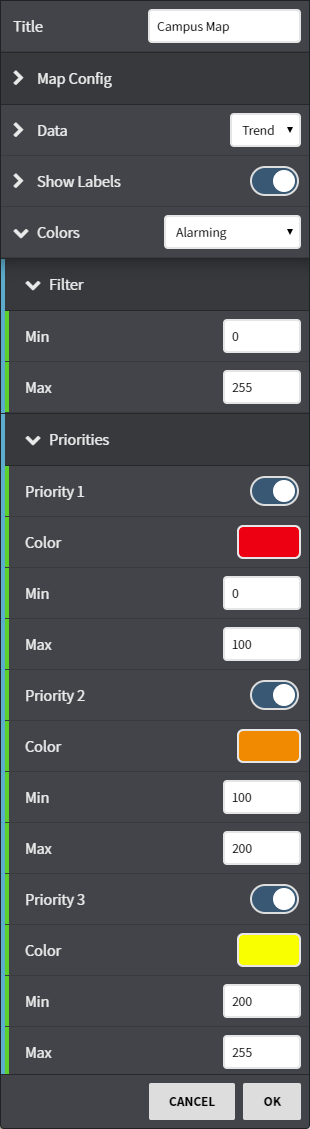
Alarming - [ Off, Filter, Priority ]


Alarms on the Map are displayed as an “alarm bell” icon on buildings where there is a current (and unacknowledged) alarm. Alarming has three options; the first of which, “Off”, disables alarms on Map entirely. The other two options, “Filter” and “Priority,” allow for control over how alarms are viewed.
Alarming Options
Off
- Disable alarms. (Alarms will not display with this option set to "Off")
Filter
- Min EnabledMin Value
- Max EnabledMax Value
Alarms can be filtered by priority value here. Priority is a value between 0-255.
PriorityPriorities
This is where different alarm priorities get colors associated to them and their ranges can be set. There are settings for three priority ranges, each with an On/Off switch, “Color”, “Min” value, and “Max” value.
Spectrum


Spectrum mode colorizes buildings according the data chosen in the Spectrum Data configuration options. Colors are determined first by finding the Min, Max, and Average values from the data, then applying colors to each of the value. Colors are customized in the Spectrum Style configuration settings.
Spectrum Style
Spectrum is colorized from three colors, Low, Mid, and High. Since a Low value may or may not indicate positive performance, the use of appropriate colors is important. Typically, red indicates off-target readings, while green indicates on-target readings.
Auto
High, Mid, and Low colors automatically mapped to data’s High, Mid (average), and Low values.
Manual
Same color options as when ‘Auto’ is selected, except High, Mid, and Low values are overridden. This allows for some corrections to outliers in the data. This is also an easy way see how buildings are performing relative to a certain target value.
Spectrum Data
Data selection, Rollup Type, and Normalize are all described in other areas of this document, and behave the same way here. Baseline compares the current value of each site against that site’s previous value. View the documentation for the Baseline Viewlet for further information regarding baseline configuration.
| Info |
|---|
This feature requires the part number PER-MAP |