The Timeline viewlet displays boolean, enumerated, and string trends as horizontal bar plots over time. This is useful in determining when an event happened, and the frequency, such as a door opening and closing event.


Configuration

Configuration Options
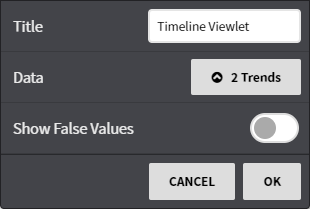
Title: Set a custom viewlet title.
Data: Select from available trends using either the Picker or Query mode.
- Show False Values: Lets users show times that were 'false' rather than 'null' in the data.