Utility Accounting Viewlet
The Utility Accounting Viewlet allows the user to import their utility bills and display monthly electricity, gas, and water usage, and other utility statistics. The numbers are shown in a chart which gives total resource consumption numbers for each utility, the cost per month, as well as the cost per unit of consumption. The viewlet also presents the figures in interactive pie and column charts to help the user visualize their respective energy usage over time. This viewlet is a great resource for tracking energy usage and associated spending over time. In the case that multiple bills exist for the same utility type for a location, they are combined to provide one total for the utility.
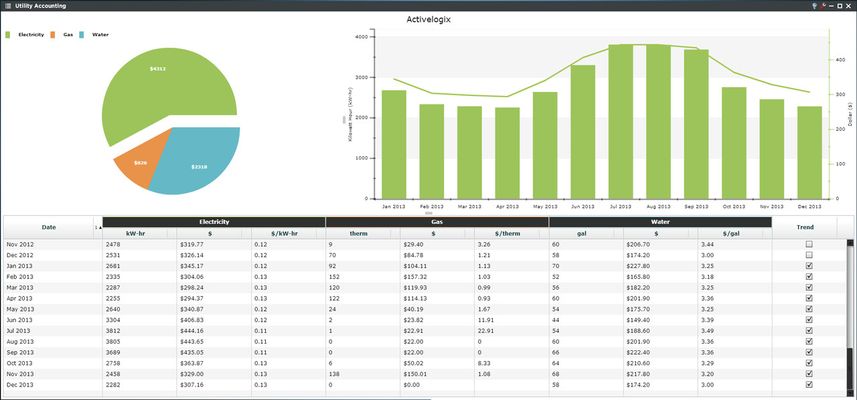
Monthly data can be added or removed from the energy analysis by checking or un-checking each location’s corresponding box, located on the right of the viewlet. Electricity, gas, and water can all be sorted, and displayed in an interactive pie and column chart.
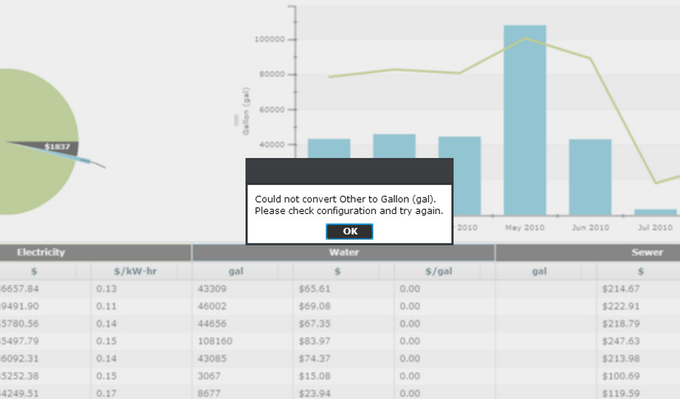
Note: if you are using units that cannot be converted to the global units for the utility you will receive an alert like this informing you that the unit on the bill itself may need to be changed.
Utility Accounting Configuration
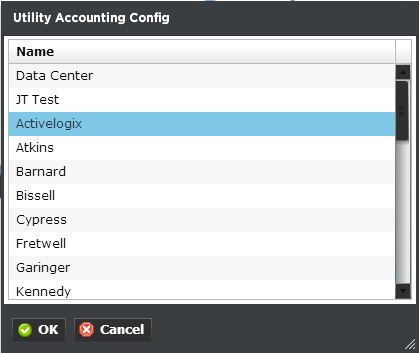
Configuring the Utility Accounting Viewlet is done through a .csv file import feature within Workbench (see below). While automatic bill import is custom, it can be arranged if desired. Otherwise, a Systems Integrator will be required to set up and import histories for water, gas, and electric data from monthly utility bills. Configuration within Periscope only requires the user to select from a list of locations that contain utility bills.
Utility Accounting Initial Setup
In order to use the Utility Accounting Viewlet, utility data must exist in the NiagaraAX station. The most common way to import data into NiagaraAX is by importing .csv files. The Utility Mapper can be found under the PeriscopeService of NiagaraAX, and comes preconfigured to import example data. The user will need to configure their own .csv file based on their utility data, and replace the file on the station with their newly created one. There are several options in Workbench when importing the file.
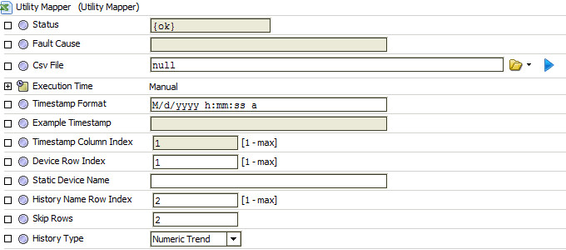
- Status - Displays the status of the UtilityMapper, "{ok}" means working correctly.
- Fault Cause - If the Status of the object is "{fault}", this property will explain what error occured.
Csv File - This property points to the CSV file that will be imported.
- Execution Time - This property determines how often the UtilityMapper will "reload" the CSV file. It can be set to manually update (only user can force an update), or to update periodically on any time frame.
- Timestamp Format - This is the format of the Timestamp column of the CSV file. The format is the standard'Simple Date Format', full documentation below. Note that if no time is provided, 12:00 AM will be used.
- Example Timestamp - This property changes everytime the Timestamp Format string is modified to show an example timestamp.
- Timestamp Column Index - This property points to the column index of the timestamp in the CSV file (forced to 1).
- Device Row Index - Often when importing CSV files, there is a need to name the "Device" of each history. This can be cumbersome when using other methods (like the File Driver) due to manually having to set each histories device name. This property tells us which row of the CSV file will be used for naming the "Device" of your history.
- Static Device Name - If any text is entered in this property, Device Row Index will be ignored and all histories will be given this device name.
- History Name Row Index - Similar to the Device Row Index, this property tells us which row to use for naming the histories.
- Skip Rows - This property tells us how many rows to skip (or in other words, how many rows from the top before actual data exists).
- History Type - Either Numeric Trend or Utility Bill. Please see the example below of a Utility Bill CSV file. Note that each bill has a "cost", "consumption", and "demand" in that locked ordering. In the example, 500 denotes the "cost" column, 1000 denotes the "consumption" column, and 1500 represents the "demand" column. Units may be specified at a later time.
Example Utility Bill CSV:
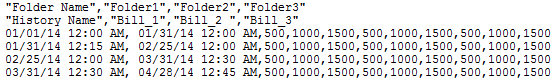
Imported utility bills are required to have a cost, consumption and demand column in order to fit the schema. Therefore, utilities with no demand value (anything except electricity) - when mapped into the dashboard - are mapped in with a third virtual for demand. That said, utilities created using the manager are mapped automatically and therefore have the freedom to have their relevant columns written without the demand column (how it's done currently). If you un-map that trend and remap it, you might notice it now has the availability to set the third "demand" virtual even if demand might not make sense for the specific utility (gas, steam, etc). This is just a quirk and will not have an effect on the cost or consumption data.
The CSV File property is locked when using the embedded UtilityMapper of Periscope. Please contact Activelogix to purchase the unlocked CSV import driver called CSV Mapper.
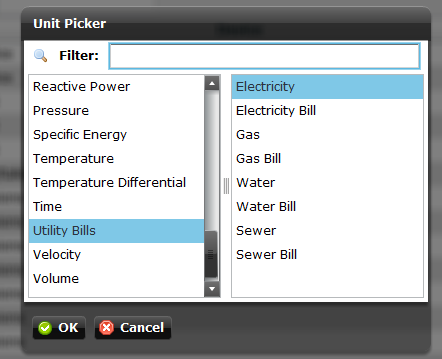
Once your Utility Bills have been converted to Histories in Niagara AX they need to be mapped into Periscope. These bills must have the Unit of Utility Bills in order to be seen by the Utility Accounting Viewlet. Electricity is assumed to be in kW-hr, gas as therms, water as gallons, and sewer as gallons.