2.3 Release Highlights
Overhauled Design
Periscope 2.3 has been completely redesigned with a new "flat" style. This design focuses on minimalism and includes completely new icons and animations across all viewlets. In addition to the new style we've optimized several areas of Periscope to increase speed and reduce any choppiness.
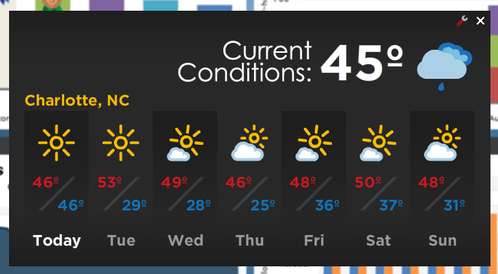
Weather Widget
Live weather can now be viewed on your dashboard with the new Weather Widget. This widget displays the current weather conditions at the top-right of the dashboard as well as a forecast view that shows seven days of data. New locations can be added via the WeatherService from the Niagara Workbench.
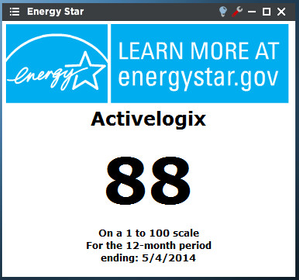
Energy Star Integration
Periscope can now integrate directly with Energy Star Portfolio Manager and display property scores in the dashboard. The alxEnergyStar driver can pull utility bill data from the Energy Star database into AX and display the data in Periscope or other applications. The driver can also push meter data from Niagara directly into properties created in Portfolio Manager. This automated process can save an Energy Manager a significant amount of time since utility bills will no longer have to be manually input.
Energy Star data and scores can also be displayed directly in Periscope including the ability to Rank properties based off of their score.
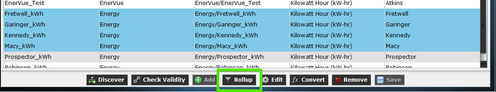
History Grouping Updates
The History Grouping feature has been overhauled with a focus on ease of use. Virtual Histories (rollups or conversions) can now me edited and deleted from the Trends tab in PeriscopeConfig. Rollups can now be created on the Trends tab (once the user selects more than one trend) rather than having to go to the History Groups tab.
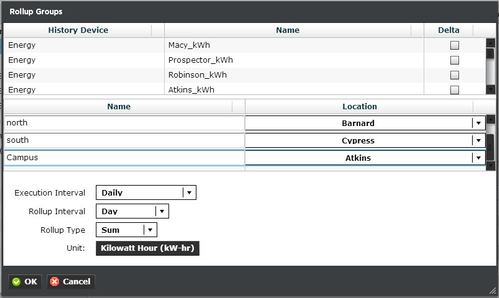
Smart Rollup
"Smart Rollups" is a feature of the Periscope Config History Grouping tab and is a massive time saver. This feature allows a user to roll up an entire history group from the root level and each child group will also be rolled up into separate trends. For example, a history group of region>state>city>building could easily have hundreds of different folders representing each level of the tree. In Periscope 2.2, rolling up each folder of the tree would take a considerable effort. In Periscope 2.3 the user can select the top of the tree and automate the process of rolling up the entire tree up to the top level.
In addition the rollups have been heavily optimized to handle large nested history groups.
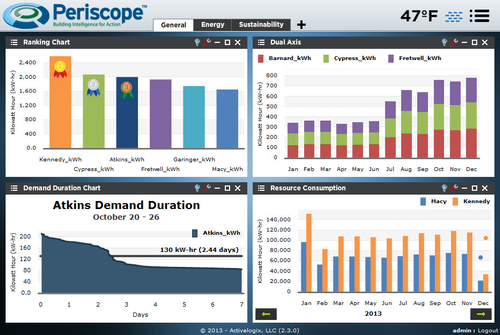
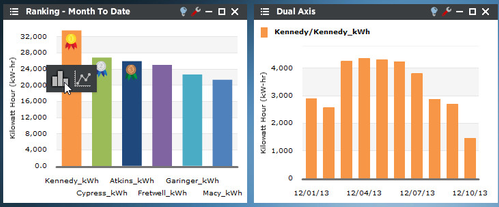
Improved Smart Drilldowns
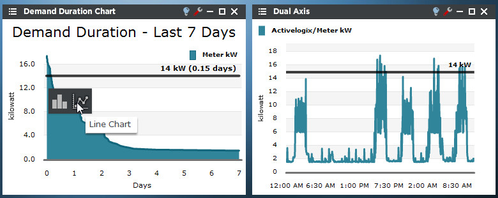
Smart Drilldowns were introduced in 2.2 for a select number of viewlets and allowed a user to "drill down" into the time range of a selected trend. In the screenshot below the second viewlet "Dual Axis" was created automatically by clicking on the Kennedy ranking column, and clicking the column chart. This feature has been expanded to include the Demand Duration, Dual Axis Viewlet, and Year Over Year viewlets.
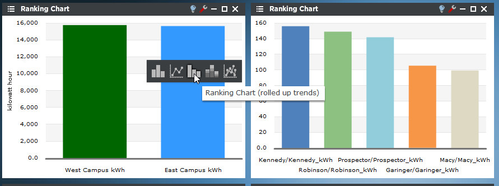
New in 2.3 is the ability to drill down into the trend hierarchy instead of always drilling down into the time range like above. This feature can only be used with rolled up trends (ones created in PersicopeConfig using the "rollup" feature). For example, in the screenshot below the "East" trend is a rolled up trend consisting of Fretwell, Garinger and Kennedy. When clicked it presents several new options to further drill into the data. The new options are:
- Ranking - Creates a new Ranking Chart with all children trends (only available in Ranking Charts)
- Stacked Column - Creates a new column chart with stacked columns
- Multi-Line - Creates a new Line Chart
User Manager Security and Usability
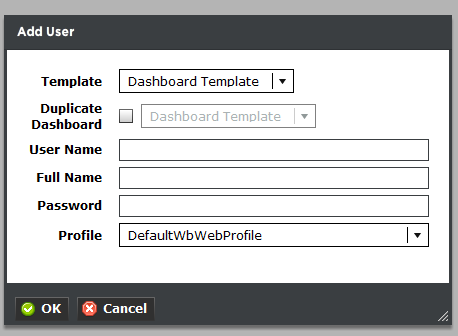
The User Manager has been redesigned to make it easier to use for non-Niagara users. The main change is that a new "Dashboard Template" user is automatically created when Periscope 2.3 is installed. This user will always be the default Persicope template user, therefore should be configured by the SI installing 2.3. In Perisocpe 2.2 the default was "admin" which caused many Periscope Config users to create copies of super users. Other changes include the separation of permission template and the "duplicate dashboard" feature as well as a new column that shows whether a user is a super user or not.
Ranking Viewlet Updates
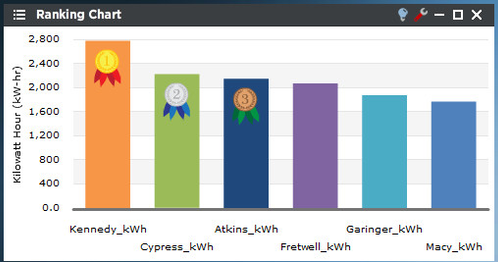
The Ranking Chart has several new features which assist users creating competitions. The Ranking Chart can now run baselines against previous time frames (similar to the baseline viewlet). For example, you can now show the percent change from This Month vs. Last Month, This Year vs. Last Year, and many more. In addition the Ranking Chart can display icons for the top three trends, including ribbons or trophies.
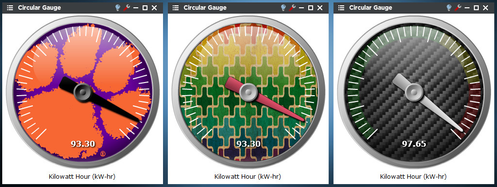
Gauge Background Images
Circular Gauges now support a user-supplied background image. This feature can use any image from the web and can quickly personalize a user's dashbaord.
Demand Duration Updates
The demand duration viewlet has been updated with a new goal line and cursor. The goal line is a static line and the cursor follows the mouse which allows quick visibility of the time period above a certain threshhold. In addition, drilldown ability has been added. The below screenshot demonstrates the goal line (set to 14) and a chart that has been drilled into. We can now see the exact days of the past 7 days in which we surpassed 14 kW.
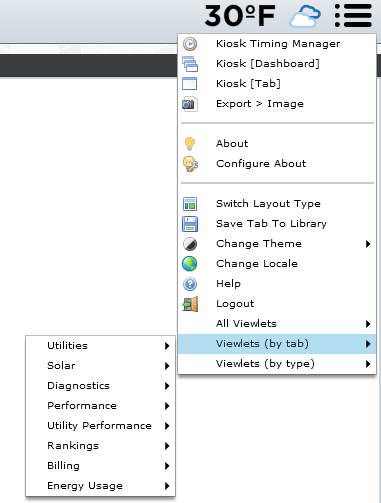
Viewlet Navigation Menu
There are now 3 new menu options available from the dashboard menu that allows users to quickly locate and navigate to any tab or viewlet in the dashboard.
"All Viewlets" - is a view that allows for selection by a specific viewlet title. Viewlet titles can be customized via the viewlet menus.
"Viewlets (by tab)" - organizes the viewlets by their tab names which are ordered from top to bottom as they are ordered left to right. Tab names may be customized by hitting F2 while on a specific tab.
"Viewlets (by type)" - gives a quick view of the different types of viewlets are in use in a particular dashboard. In a large dashboard, users may now search for and select the viewlet they're looking for even if only knowing that it was a ranking chart.
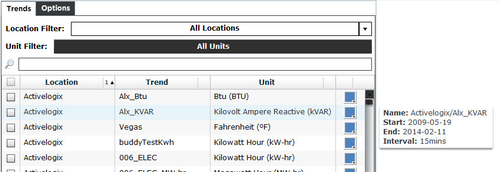
Trend Selection Tooltips
Now with 2.3, it's possible to catch a quick glimpse of what a histories data looks like without adding it to the viewlet. In 2.3, it's now possible to see the name, start and end timestamps, and common interval of the history. Users will no longer have to keep changing configuration options to try and find out when the history started or ended nor guess what rollup interval is needed to properly display the history at the interval it's being collected.
Trend selection tooltips will also help prevent users from mixing histories of different intervals unintentionally.